
Trading Articles
A selection of great trading education articles covering all aspects of trading forex, commodities, crypto and stock indices.
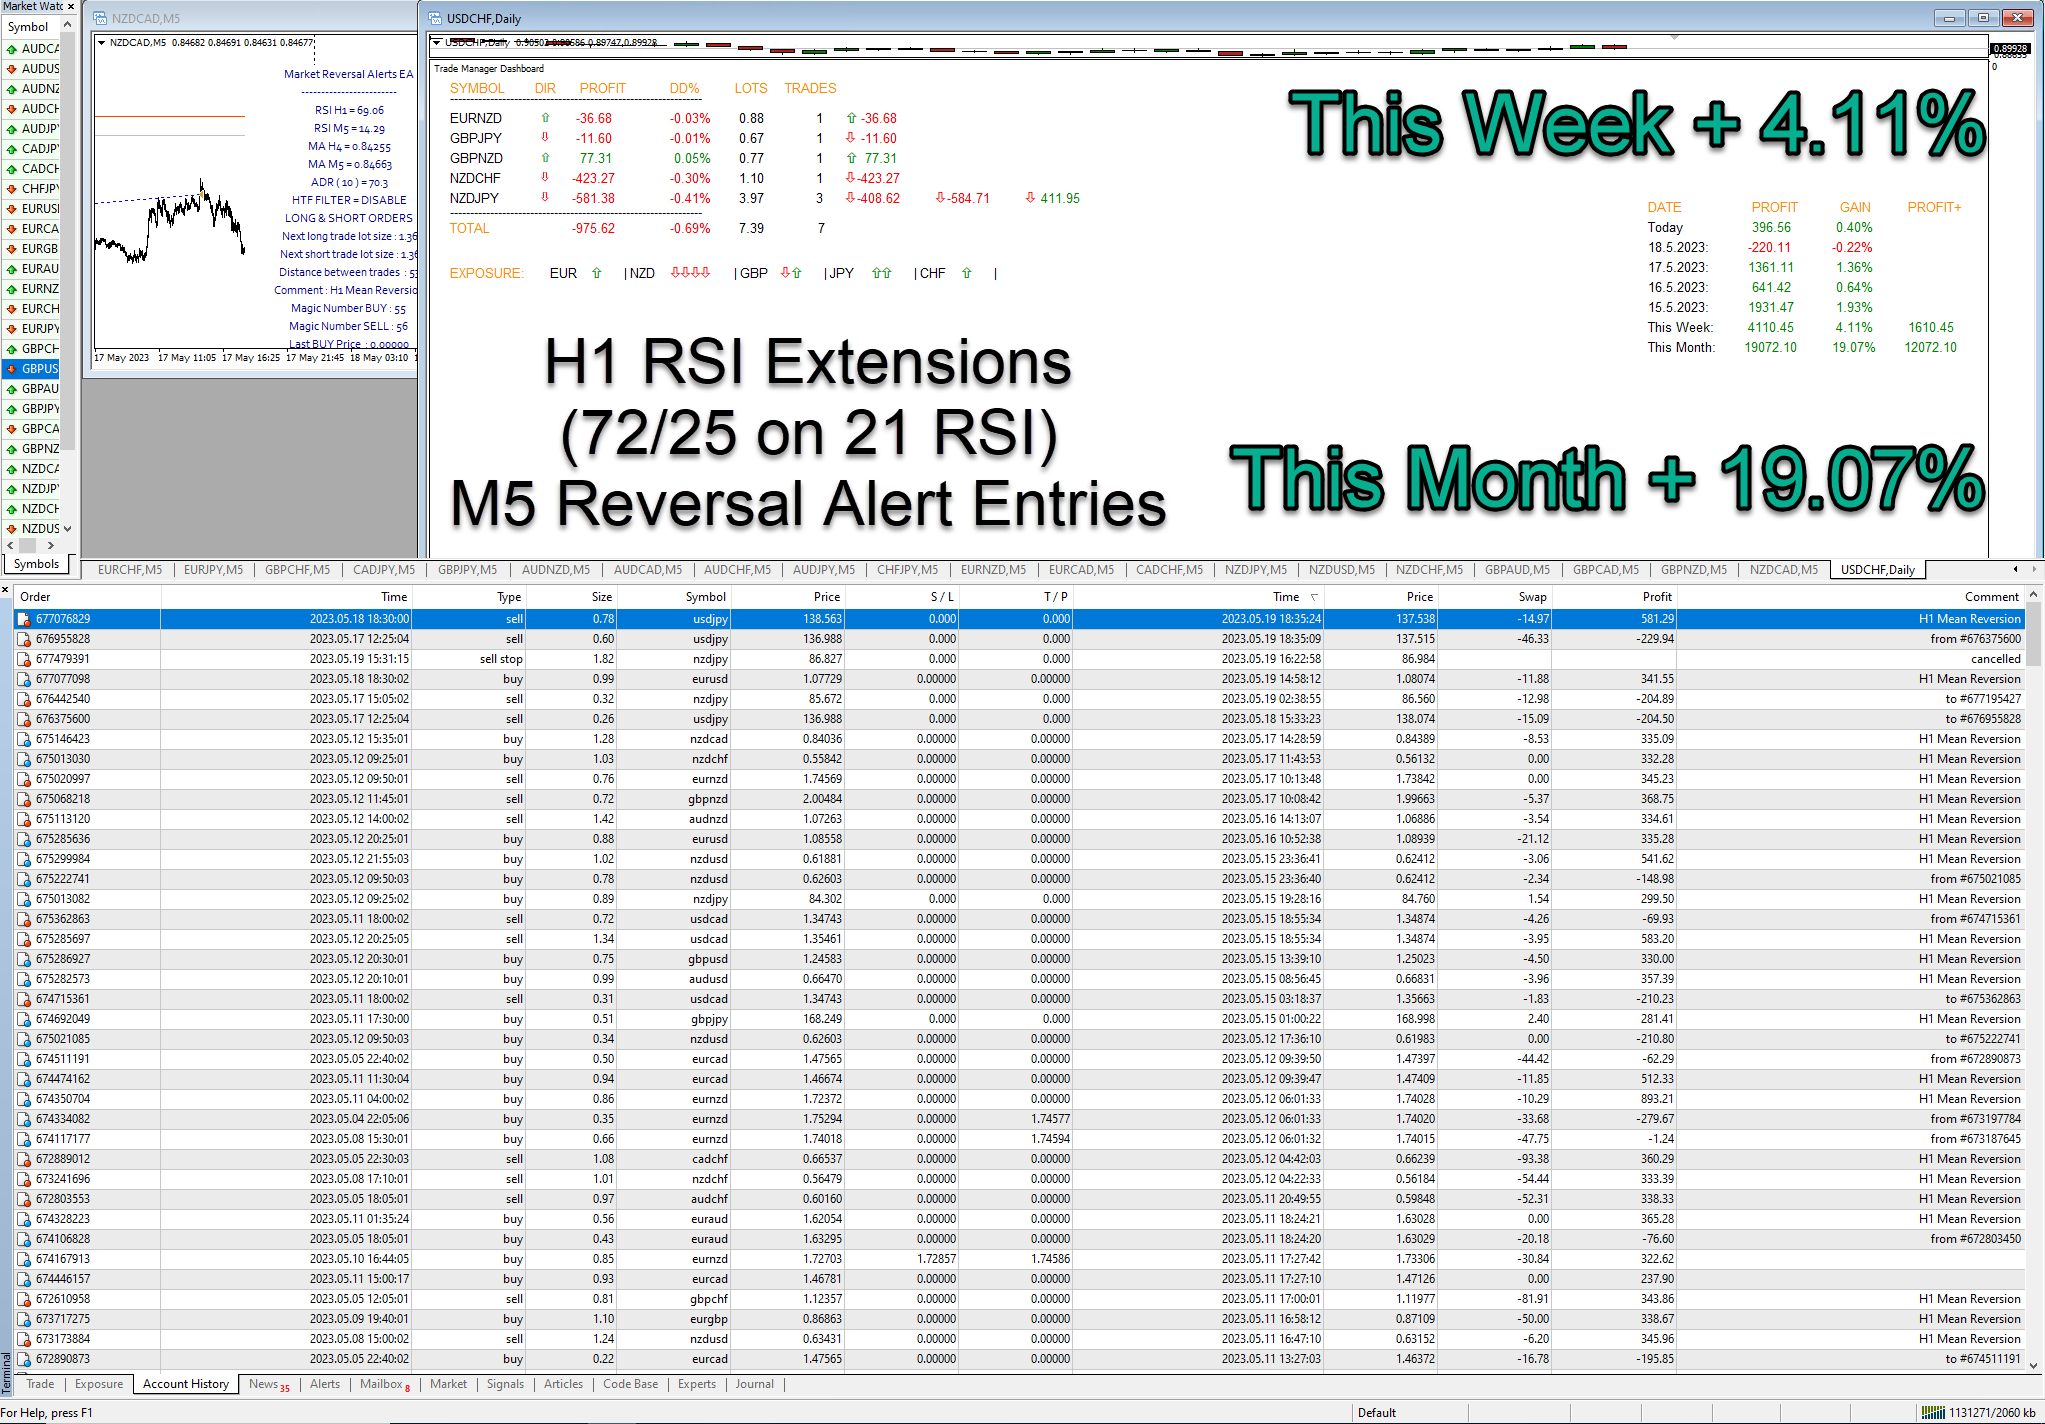
16.7% Banked this week across all 4 main strategies with the MRA EA
Had a pretty decent week this week with the Market Reversal Alerts EA and the main strategies taught in the position trading bootcamp. Over 16% return across all 4 accounts with very little open drawdown on the main strategies. The hedging strategy is in a little drawdown at the moment but it’s always in drawdown of some sort due to the nature of heading meaning you always have some trades going the wrong way temporarily! The month so far (with more than 1 week to go still) is currently sitting at 64.16% cumulative total for the 4 accounts. Will it get to that magic 100%? Join me every day in the live rooms at 7:50am and 2:20pm UK time for analysis of new position trading setups and a look at the results every day.
Check out the EA here: https://themst.info/mraea
Watch the position trading bootcamp here: https://themst.info/bootcamp

What The Market Reversal Alert Indicator and Dashboard Does
Find out what the market reversal alerts indicator and dashboard does and how it can help you identify potential reversal points and shifts in market structure trading forex, crypto, metals or indices.

Market Reversal Alerts EA V4 and V4.1 Differences – Logic Change For Position Trading Strategies
This video shows what’s new in version 4.1 of the EA. This update is purely a logic change and tweaks an issue found by some position/basket traders that were manually closing positions or letting the EA handle drawdown control. This update simply changes the way the EA stores the last traded level and lot size so it gets into additional positions more conservatively and will help with drawdown and manual closing.

Market Reversal Alerts Indicator Installation & Settings
An overview of all the settings for the market reversal alerts indicator.

Market Reversal Alerts EA Version 4 Settings & How To Effectively Backtest & Develop Strategies
This is the Zoom session introducing the new options for version 4 of the market reversal alerts EA. There is a lot more strategy tester information in this video too showing you how to effectively backtest and develop strategies using this or any EA.

Market Reversal Alerts Dashboard Settings & How To Use It
An overview of all the settings for the market reversal alerts dashboard indicator for MT4.

Price Action Toolkit EA Settings & Strategy Overview
An overview of the Price Action Toolkit EA and what it’s designed to help traders do.

How To Turn A Losing Trade Into A Winner
This is an extract from a live room session where we are talking about ways to exit position trades that have gone a little too far against our original idea. Basically, we’re turning a losing trade into a profitable trade with a strategically placed “big whale” trade, which can bank a big return.

How To Survive a Squeeze While Trading Mean Reversion In A Trend
This is an extract from the live room where I was asked about the market reversal alerts EA and the strategies it trades (mean reversion trading strategies) and whether they would work in a trend. Mean reversion trading relies on the market’s natural ebb and flow being fairly rhythmic in nature and as long as this condition exists you can certainly trade mean reversion strategies. When position trading in a trend, however, you will occasionally get squeezed, meaning the market moves strongly against you for a period of time. In this video, we look at how to get out of those situations and still come out with a small profit or very small loss.

How To Draw Support & Resistance | Simplest Way
People struggle with support and resistance levels and try to overcomplicate a very simple thing. They miss entries because they are not creating these areas, a zone’s price will test and try to get that perfect line. Support and resistance is NOT a straight line, it’s an area. In this video, you will learn how to make sure your entries are spot on and your stops are positions well enough, so you get a profit the majority of the time.

The Ultimate Traders Risk:Reward Calculator Spreadsheet – You NEED This.
This risk reward calculator spreadsheet will help you see what you need to achieve to hit your profit targets with whatever strategy you use when trading. You can see what happens when you have a winning or losing streak to help prepare yourself for what is likely to happen to your account as you trade any instrument or strategy.

What Candlestick Propulsion Gaps Are | 1-2-3 Gaps | Wide Range Bars etc…
Propulsion gaps (that’s what I call them anyway!) are also known as 1-2-3 gaps, wide range bars, fair value gaps and all sorts of things. Basically they are a large move in the market caused by institutional buying or selling and traders need to pay attention to them. The original concept was defined by M.A. Perry, the owner of thestrategylab.com website, and his original concept has been used by many other traders over the years. This is the official definition of what a WRB (Wide Range Bar) actually is, according to him. Every trader should be aware of these awesome magnets that attract and repel price.

How To Make More Money Trading: Why I Don’t Trade Gold
This is an extract from a live room session talking about why I personally removed gold from my trading portfolio and how you can improve your performance by identifying what is making you losses. It’s a bit of a “joke” session and video but the message is real and something that helped improve my trading career. Remove the losses, your profits soar!

How To Make Money Trading Symmetrical Triangle Breakouts
A symmetrical triangle chart pattern represents a period of contraction & consolidation before the price is forced to break out to the upside or breakdown. They are very easy patterns to find and trade and work on everything you can trade including stocks, indices, crypto and forex. A breakdown from the lower trend line marks the start of a new bearish trend, while a breakout from the upper trend line indicates the start of a new bullish trend.

How The Forex Market Moves & How To Measure Your Trading Success
Day one of the position trading bootcamp. This is a 5-day forex trading course designed to help you understand how to position trade and benefit from the natural ebb and flow of the foreign exchange markets. In this lesson, we look at the course overview and what we’ll be covering. We also kick off with a look at how to measure your success as a trader and why you should not use pips for that, or indeed for anything! Then we take a detailed look at how and why the market moves, who the main participants are and how we can take advantage of the natural ebb and flow of the forex markets.

Multi Time Frame Trading Analysis, Elastic Band Theory & Trading Psychology
In this lesson, we look at multi time frame analysis and how it can help us to time entries based on the bigger picture. Using a higher time frame for our trade idea means the idea is generally better, as higher time frame signals are more accurate. We also cover elastic band theory, how the market expands and contracts when buyers and sellers enter the market and drive price based on exhaustion. Finally, we look at the difference between stop loss traders and position traders. How the psychology of trading with a stop loss causes most traders to fail and hop systems continuously.
Top Trading Indicators To Use For Position Trading Strategies
In this lesson we look at indicators, nothing but indicators (and a little sneak peek at strategy!). I go through all the indicators that make up my strategy and explain why I use them, how they work and ways to put them to good use and extract money as a position trader.

AUTOMATIC Support & Resistance + Propulsion Candle Gap Target Indicator
Here we take a look at the support and resistance indicator for Metatrader that helps traders identify key levels in the market that price is likely to head for. The indicator automatically draws in key support and resistance levels from the daily, weekly and monthly timeframe, meaning you no longer have to manually find those levels and keep adjusting them on your charts. When trading, you will notice that price moves to and from support and resistance levels constantly and creates large strong moves called propulsion candles which act as easy targets for price to retrace to.

How To Position Trade, Trading Risks & Managing Your Drawdown
This is the lesson where it all starts to come together. How to position trade and how to actually place your trades into the market. We also take a detailed look at risk management and drawdown control, as well as aggressive drawdown control to get out of positions that don’t go your way. Finally, we have a look at Martingale and how that effects this style of trading.
Strategies To Use as a Position Trader Explained In Detail
The final day of bootcamp covers the strategies I personally use to enter the market. Exactly what I’m looking for, what indicators I use for each strategy, and my exact entry and exit criteria. We also look at how the EA can automate entries with the strategies too and see it in action doing exactly that.
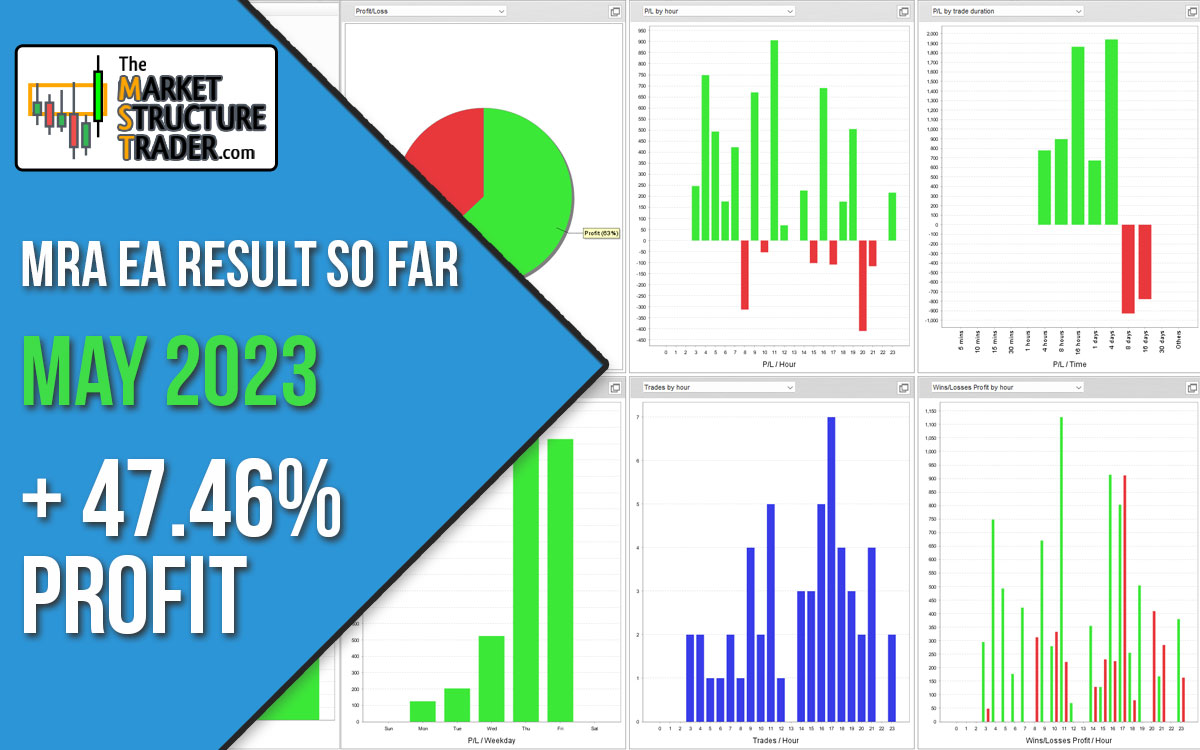
15.1% PROFIT THIS WEEK | 47.46% PROFIT SO FAR IN MAY!
I’ve posted a number of videos on YouTube about the Market Reversal Alerts EA results in the last few months. Those are listed at the bottom of this post. I don’t have time this weekend to do another video, so thought instead I’d just post the results of the 4 main strategies I teach in the position trading bootcamp that are executed by the EA. The set files for each strategy (MT4 versions) are linked here too.

March 2023 Trading Results For The Market Reversal Alerts EA
March 2023 was a bumper month for the 4 core position trading strategies taught in the position trading bootcamp. Results shown are based on $100k accounts and included is the new H1 hedging set file that the Market Reversal Alerts EA has been running, which is a variation on the M5 hedging strategy taught in the bootcamp.

Why Traders Need To STOP Buying Courses & Their Strategies Fail
Markets go up, markets go down, you get in, you get out, it’s that simple! Trading forex or any instrument with any trading strategy is incredibly hard to master. Everything you learn is the same thing told differently, over and over again using different language. All trading strategies are rubbish and none of them work, not because they are no good, but because when it comes to entering the market they all have the same odds of success. Often this is nothing to do with the strategy and all to do with the trader taking the trades! The markets are random and controlled by banks, what makes you think a course is going to help you make money? Technical analysis is useless, and all the books and courses teach you how to get a 50/50 shot at a random result.

20% Trading Profit in 1 Week! The Exact Strategies Explained + The EA Used To Execute Them
I was asked a few times by new people to the live rooms in Telegram to explain the strategies and EA settings, so here they are, easier to record a video for everyone than explain it multiple times! 😉

See The Market Reversal Alerts EA in Action – 5 Profitable Strategies To Use
This video shows just 5 of the many profitable strategies you can use with the market reversal alerts EA. This is a “Swiss Army Knife” EA, and you can create and fine tune endless profitable strategies with it.

8 High Probability Trading Strategies To Use With The Market Structure Reversal Alerts Indicator
Learn what the market structure reversal alert indicator and dashboard does and some key strategies to use when trading with it.

A Brief Overview Of Market Structure – Learn & Understand it In Under 3 Minutes!
This is a simple explanation of what market structure is, and it’s designed to show you what the market reversal alert indicator is potentially showing you is about to happen. There are tons of resources out there on this, so it’s just a quick lesson to explain the basics.

Why Are You System Hopping? You Need to Stop Trying Different Trading Strategies!
Every trader does it, it’s part of the trader’s education and path to becoming successful. But do you really understand why you are trying system after system, indicator after indicator? There’s usually nothing wrong with your trading system, it’s your understanding of how that system will play out that is often at fault.

You Have No Control Over The Market! Accept it and Move on
Understand that as a trader, whatever strategy or indicator you use has no way of telling you where the market is going to go next. You know two things, it’s going to go up and down and sideways, accept it! No trader has control over where price will go next. This short video explains why you have no way of predicting future market movement.

How to Profit From Average Daily Range (ADR) Reversals – Simple Strategy & Powerful Indicators
Average Daily Range (ADR) is a highly useful and powerful measurement that can give you a real edge in any market that is tradeable on forex, crypto, stocks and indices. This video introduces ADR and a simple way to get an edge using it, as well as some powerful indicators that will help you get into trades at key levels to make profits.

My Top 3 Stop Loss Based Strategies To Use With The Market Reversal Alerts Indicator
The market reversal alerts indicator is incredibly powerful and fits perfectly with virtually any system to enhance and confirm entries into any market. These are the top 3 ways I use the indicator to find high probability setups on multiple time frames.

How To Draw Support & Resistance Properly To Find Potential Turning Points In Any Market
Support and resistance can be either fixed or dynamic, and is a vital part of the majority of trading systems. People often try to make it pip perfect, but it’s better to look at these areas as more of a zone and use multiple time frames to fine tune levels and look for signals in those areas.

Learn The Top 8 Candlestick Patterns For Trading Forex & Where You Should Be Looking For Them
Candlestick patterns are very powerful when used correctly, they show when weakness is starting after a push and tell you when it’s right to take a trade. Forget the rest and concentrate on these top patterns, and you’ll start timing your trades perfectly and get much better risk:reward ratios too.

Mean Reversion vs Trend Trading – Which Is The Best To Trade?
Ask yourself if you want to be right or profitable? The forex market and most markets in general spend around 80% of their time ranging and reverting to the mean average of price. If you are trying to catch that big trend, you are missing out on 80% of the trading opportunities out there!

Backtesting RSI With Forex Pairs To See How Effective It Is For Position Trading Strategies
The RSI has a bad reputation, and this is mainly due to everyone trying to use it with a stop loss to get entries when it’s in extended conditions. However, it’s incredibly reliable if you are a position trader like me as it give a great initial entry which you can average into to make profits easily.

How To Use Multi Time Frame Analysis To Pick Market Direction & Decide Your Best Trading Timeframe
Picking a direction in trading is one of the hardest parts to master. Choosing your timeframe is also a hard part many traders struggle with. This video aims to help with that by giving you simple ways to make those choices.

The Top Market Reversal Patterns You Should Look Out For When Trading With The Market Reversal Alert Indicator
There are so many chart patterns out there for traders to use, it can be confusing at times. There are a few main ones however which work beautifully and are easy to spot with the market reversal alerts indicator.

What Is A Trading System – Let’s Break It Down
No single indicator will give you great results when trading any forex pair, index, crypto or commodity. You need a system that gives you an edge which will be made up of multiple moving parts. Here we take a look at what a trading system or strategy is and what it needs to work.
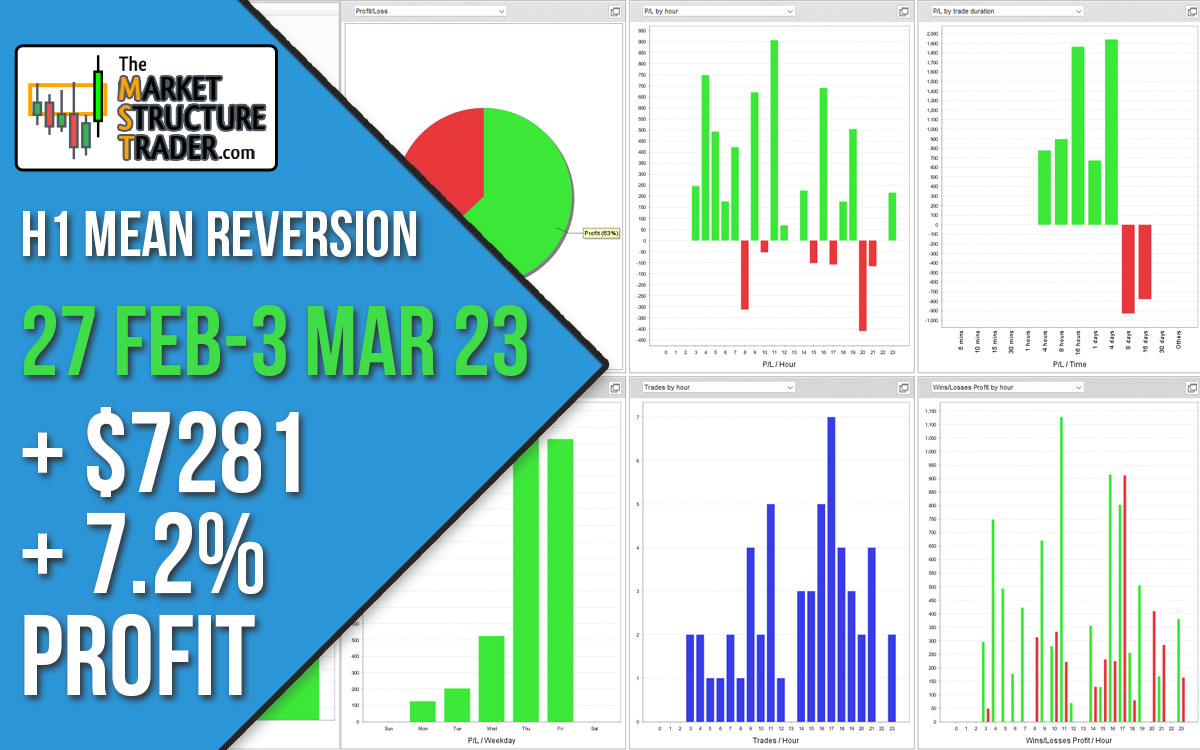
$7281 Profit (7.28%) – Every H1 Mean Reversion Forex Trade This Week – 27th Feb – 3rd March 2023
This is a breakdown of every H1 RSI mean reversion strategy trade closed this week by the market reversal alerts EA. You can download the set file used from the blog post on MQL5. Read the post to see every trade taken in detail. This is an exhaustion strategy that trades only when price has pushed hard for a period of time and the RSI (relative strength index) indicator signals that the market is in an extended condition. As this strategy trades on the H1 timeframe with the 14 RSI, it’s a lot faster at getting in and out than the H4 version of the strategy. Slightly more risky but more rewarding too.
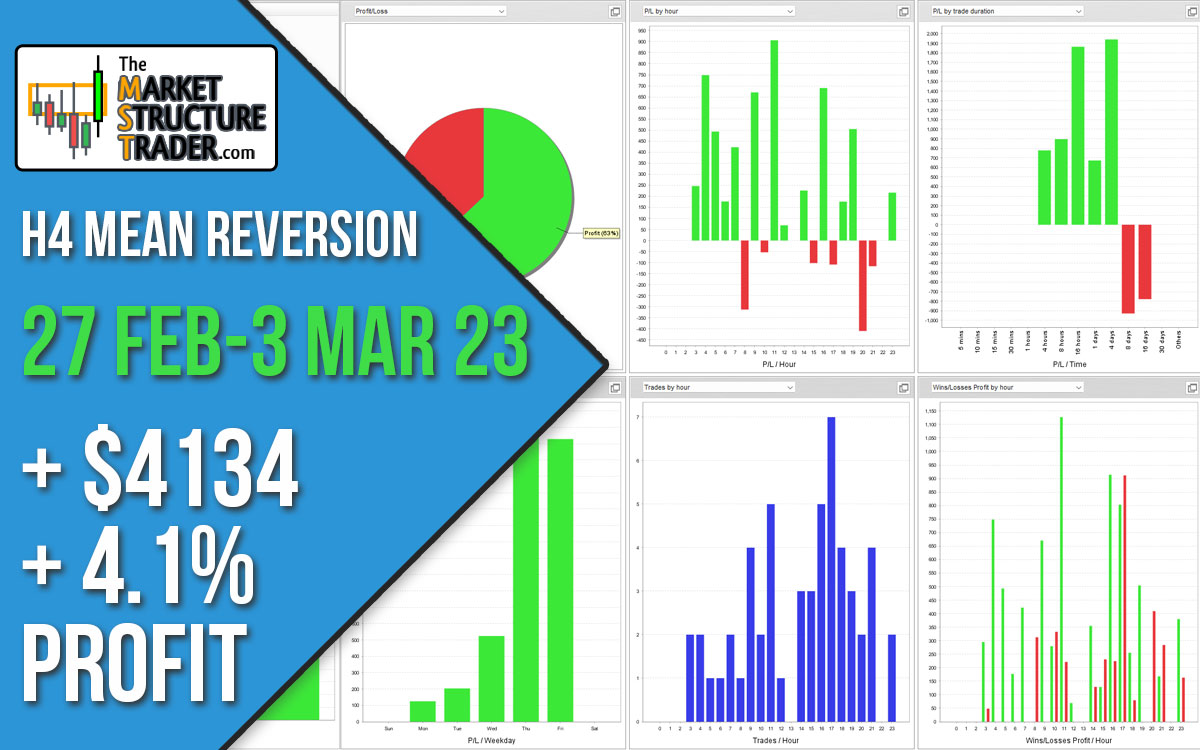
$4134 Profit (4.1%) – Every H4 Mean Reversion Forex Trade This Week – 27th Feb – 4th March 2023
This is a breakdown of every H4 RSI mean reversion strategy trade closed this week by the market reversal alerts EA. You can download the set file used from the blog post on MQL5. Read the post to see every trade taken in detail. This is an exhaustion strategy that trades only when price has pushed hard for a period of time and the RSI (relative strength index) indicator signals that the market is in an extended condition. As this strategy trades on the H4 timeframe, it is a lot slower than others, but will incur less risk and more accurate entries. Smaller weekly profits consistently banked over time.

$9271 Profit (9.2%) – ADR Reversal Forex Trades This Week – 27th Feb – 3rd March 2023
This is a breakdown of every ADR reversal strategy trade closed this week by the market reversal alerts EA. Read the post to see every trade taken in detail. You can download the set file used from the blog post on MQL5. This is an exhaustion strategy that trades only when price has moved beyond its normal daily range and the EA detects a move starting in the opposite direction, which may be a profit take move started by the banks. The target for each position taken is just 1/3 of an ADR (average daily range) or 1/4 percent account gain, whichever comes first.

$1762 Profit (1.75%) – Every H4 Mean Reversion Forex Trade This Week – 20th-24th Feb 2023
This is a breakdown of every H4 RSI mean reversion strategy trade closed this week by the market reversal alerts EA. You can download the set file used from the blog post on MQL5. Read the post to see every trade taken in detail. This is an exhaustion strategy that trades only when price has pushed hard for a period of time and the RSI (relative strength index) indicator signals that the market is in an extended condition. As this strategy trades on the H4 timeframe, it is a lot slower than others, but will incur less risk and more accurate entries. Smaller weekly profits consistently banked over time.

$4442 Profit (4.4%) – Every ADR Reversal Forex Trade This Week – 20th-24th Feb 2023
This is a breakdown of every ADR reversal strategy trade closed this week by the market reversal alerts EA. Read the post to see every trade taken in detail. You can download the set file used from the blog post on MQL5. This is an exhaustion strategy that trades only when price has moved beyond its normal daily range and the EA detects a move starting in the opposite direction, which may be a profit take move started by the banks. The target for each position taken is just 1/3 of an ADR (average daily range) or 1/4 percent account gain, whichever comes first.

How Inflation Affects the Currency Markets
In this article, we take a look at how inflation affects the currency markets and why you need to be aware of changes in inflation related when trading FX pairs.

Weekly Forex Analysis For 4th February 2023
See what the fundamentals point to as being the tops buys and sells this coming week and all the important news events happening that will affect the forex markets. Also, what’s changed with the commitment of traders this week that may affect your bias heading into Monday’s trading session.

Opening Range Breakout Strategy
Learn to trade a simple strategy designed for the stock market indices like the DAX, DOW, NASDAQ, FTSE and S&P500. The reason it is so effective on those instruments is because we know when volatility will occur every day, this is at the market open. Can be traded manually or fully automated with the ORB EA.

Trend Pullback Trading Strategy
Learn a simple trend pullback strategy you can implement with the market reversal alerts indicator, the RSI and 2 moving averages. Only takes 15 minutes a couple of times per day to find setups and often generates large movements over many days.

Mean Reversion Trading Strategy
Learn how to trade mean reversion strategy using the RSI. Find opportunities where profit take moves are likely to commence, so you can jump on board at the start. It doesn’t get much simpler than this or easy to back test an edge!

Yesterdays High & Low Reversals Trading Strategy
Want a simple strategy using market structure reversals on the M5 timeframe? Check out the yesterday’s high/low strategy. Super simple and captures intraday movement. We know the market needs liquidity to fill orders, these highs and lows are where it’s usually found, so focus on these levels intraday.

Hedging Trading Strategy
Learn this simple hedging strategy that extracts money from the market using the natural choppy nature of lower timeframes like M5 and M15. It is also effective on higher timeframes, as they also have a cyclical movement. Pair it with pairs that are expected to be range bound for the best results.


Join the Telegram Group
Join the Discord Server
Get The Indicators & Dashboards I use
The indicators are all available direct from your MT4 or MT5 platform in the market section. Alternatively, you can get them on the MQL5.com website!

The Market Reversal Alert Indicator
The key to the strategy is knowing when price is starting to turn and change direction. This indicator draws in market structure for you, then sends you an alert so you can take a look at your charts and see if there is a valid reason to enter a trade.

The Market Reversal Alert Dashboard
This amazing dashboard monitors the major time frames and all pairs you trade and alerts you instantly when a potential reversal happens. No more staring at charts all day! Every pair and key time frame in front of you in one MT4 window. Priceless.

The ADR Reversal Indicator
The ADR Reversal Indicator shows you at a glance where price is currently trading in relation to its normal average daily range. You will get instant alerts via pop-up, email or push when price exceeds its average range and levels above it of your choosing.

The ADR Alert Dashboard
The ADR reversal dashboard allows you to monitor every pair or instrument you trade in one dashboard. You’ll get alerted every time something exceeds your set ADR levels and ensure you will never miss an opportunity.

The Trade Manager Dashboard
Take control of your forex portfolio. See instantly where you stand, what's working and what's causing you pain! The Trade Manager Dashboard is designed to make risk management and exposure to currencies easier to understand.

The RSI and TDI Alert Dashboard
The RSI / TDI alert dashboard allows you to monitor 6 main timeframes (selectable by you) at once on every major pair you trade. The dashboard will alert you to extended conditions (overbought and oversold) when a candle closes on the chosen time frame.

Symmetrical Triangle Pattern Indicator
Profit from market contraction and consolidation after price makes new highs or lows in the market. Get alerted when a contraction is happening, ready to pounce on the next continuation or reversal move that is building up.

Symmetrical Triangle Pattern Dashboard
Get alerted and see instantly when any instrument you trade forms a symmetrical triangle pattern on any time frame. Get ready to pounce on those triangle breakouts!

Opening Range Breakout EA
Profit from the explosive moves that occur at the open of stock indices and give yourself an actionable edge every day. The opening range breakout EA can be tweaked to your liking to capture the trends that form just after the open every day on the main stock indices like the DAX, DOW, NASDAQ and S&P500.

The Market Reversal Alerts EA
Based on the indicator, this EA will auto trade signals generated from the market reversal alerts indicator. It has powerful filters to configure as you like to trade including ADR, MAs and RSI. You can also use it to basket/grid trade, and it has every risk option you can imagine.

The Price Action Toolkit EA
The missing piece of functionality in MT4!
Fast order buttons to quickly enter, adjust and exit positions and scalp with lightning speed. Get price action candlestick alerts on the most commonly traded patterns and auto execute entries and exits based on your preferences.

Support, Resistance & Propulsion Gaps
Automatically draw support and resistance levels PLUS propulsion candle gaps on your chart, so you can see where price is likely to head next and/or potentially reverse. This indicator is designed to be used as part of the position trading methodology taught on this website and displays key information for targeting and potential entries.

Stock Index Hedge EA
Take advantage of the opening volatility of the major stock indexes and profit from the sudden moves created at those times when the market breaks away at the opening bell. The strategies’ goal is to simply benefit from those days when the market moves fast and hard in one direction at the open and bank that move.