
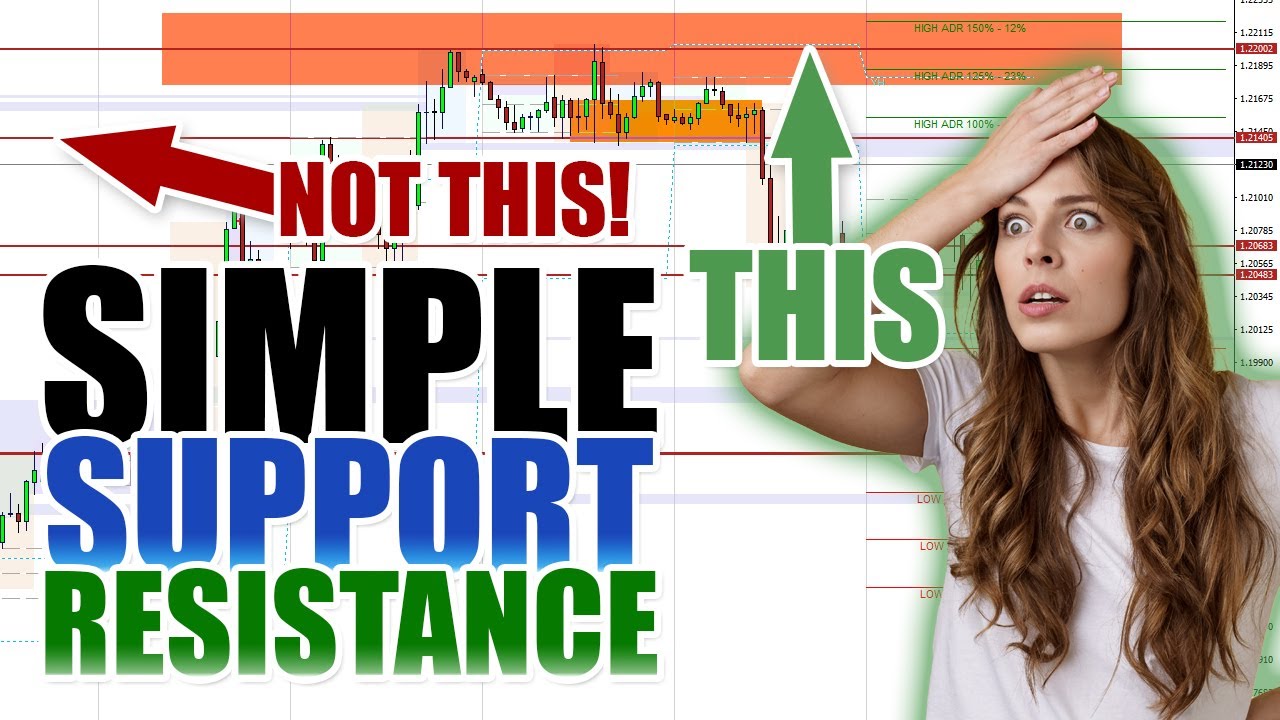
This is an extract from a live room session talking about support and resistance and how to draw it properly without constantly getting stopped out when price tests it. It’s a strategy in its own right!
👉👉👉 Join the live rooms daily here: https://themarketstructuretrader.com/the-live-room/
People struggle with support and resistance levels and try to overcomplicate a very simple thing. They miss entries because they are not creating these areas, a zone’s price will test and try to get that perfect line. Support and resistance is NOT a straight line, it’s an area. In this video, you will learn how to make sure your entries are spot on and your stops are positions well enough, so you get a profit the majority of the time.
👉 Get the indicator that draws in good support and resistance areas here: https://www.mql5.com/en/market/product/97246
👉 Market Reversal Alerts EA To Automate Your Trading: https://www.mql5.com/en/market/product/65383
👉 All Indicators Used On My Charts Are Available Here: https://themarketstructuretrader.com/the-indicators/
👉 The FREE Position Trading Bootcamp Course is Here: https://themarketstructuretrader.com/category/the-position-trading-bootcamp/
👉 Join Me & Position Trade Daily For Free In The Live Room Twice a Day: https://themarketstructuretrader.com/the-live-room/
👉 Join The Community Chat on Telegram Here: https://t.me/market_structure_trader_chat
Video Transcript
Okay, so support and resistance. So basically the idea behind this session is obviously because I trade prop, I trade with a stop loss on my prop accounts, basically, because you’ve only got a small amount of working risk. You’ve got 5% on a daily basis, and usually somewhere between 8% to 12%, depending on which prop firm you’re in. So yesterday, basically, I posted my P&L because I just had a nice day on prop, and I banked it and extracted it, and that sparked a conversation with somebody about support and resistance, because basically he asked, you know, why did I take those trades?
So all of the trades that I take on prop are taken at support resistance levels. They are all using market structure. They are all using, where possible, ADR and RSI as well. But it’s the confluence with support and resistance which makes the trades more effective. When you’re using a stop loss, as you know, if you use a stop loss, you get stopped out all the time, which is why the position trading boot camp is on the website. That teaches you how to trade as a position trader without a stop effectively, not taking huge risks, taking controlled risks without stop losses and scaling in and out of the market. When you’re on prop, it’s very difficult to do that, because you just don’t have that leverage available to you.
So you have to use some kind of stop structure to make sure you can stay in the evaluation and stay in the funded accounts as long as possible. So what I do is exactly what I do in here on a daily basis in the live rooms. I’m basically getting in and out based on market movement using the market reverse alerts indicator or EA in my case. However, I’m just picking specific levels. So let’s use this as an example what we’ve got on the screen here, the pound yen. Yeah, so that reverse alert there that you can see on M15 is an exact example of the type of trade that I would take at a level of previous resistance. Yeah, so we’ve tapped up into it, we’ve pulled back out of it. We’ve tapped up into it, we’ve pulled back out of it. We’ve tapped up into it again and market structure has shifted back to the downside. We’ve had the reversal alert there to show us that there’s been a market structure break, reversal, and obviously this is an extreme case because this is where we had the money flowing into the safe haven because of the banking problem. But that’s exactly the type of trade that I take. So if you look at this on an hourly basis yeah up here RSI was just about extended yeah but we didn’t have an ADR hit to the upside on this one yesterday at that point. So what I will do is I will use RSI when we get an RSI extension and I get an alert on the RSI dashboard to go and look at a pair.
I’ll go like Aussie New Zealand, so I’ll go and have a look at it. And I’ll say, right, brilliant. We’re extended on the RSI. Are we at a previous level of support and resistance? Yes, in this case, we are. We’re at a previous area of balance where we have previously come to and rejected. So we’re back at this level again at the previous area. We were at a propulsion gap. We’re at an area where we’ve rejected before and we’ve got an RSI extension.
Am I interested? Yes, brilliant. Drop down to M5, wait for a reversal alert or rather put the EA on, wait for a reverse alert and let it just get me into that trade. And what I do is I just check these, usually every two to four hours, I’m just having a look at them and seeing if we push and we drive up further and higher and through that support and resistance zone, so let’s say it’s done this, yeah, and it’s up there, I will then say, right, do I want to keep the reverse alert EA on there and wait for the next entry, or do I want to turn it off and walk away and find another opportunity?
In this case, because we’ve got this level here, which is a previous support turn resistance, I would say, yeah, I’ll keep it on because we’re probably going to do that. When we get that reverse of that, I’m going to jump in. Yeah. So that’s how I take those trades on prop. Every single one of them has a stop loss. The stop loss is usually either a quarter or a half an ADR. I’m not interested in top of the wick.
You know, you get a reverse of that. I’m not putting the stops there. I’m putting my stops a quarter to a half an ADR apart, away. Why? Because what I’m looking for is to come into a resistance area, hit it, and then pull out of it. So my stop has to be a very decent move away, because if you think about it, one of two things happens when we get to a resistance area. We never hit it to the pip, do we?
We never hit resistance to the pip. Where is resistance and support? That wick? Is it that wick? Is it that wick? Is it that wick? Is it that wick? Which wick is it? It’s not, it’s a zone. So how can you possibly say, I’m gonna get in when we hit that and put my stop just above it?
There is no above it, somewhere above it. So when we hit it, we either hit it and we go like that, or we hit it and we go like that, or we hit it and we go like that. If that is the scenario, when we get to a resistance area, I’m not gonna put my stop there, am I? That’s stupid. I need to give it room to be stop hunted. So if this now works, this trade at this area here, and then it comes up and takes the liquidity from the guys that have just shorted it and drops down, I need my stop way away from that stop hunt.
And then it will either do that and get me out, or it will do that and it will come down and get me out. Yeah, I don’t know which obviously, no one knows which way it’s going. So that’s basically how I trade on prop. So it’s using a combination of RSI extensions, ADR hits. So the dashboards are still my core if you like. I’m looking at these dashes thinking, look at these, is there an opportunity? But what I’m saying in my head is, look at the chart, look left, is there an area on this ADR hit, to the upside or downside, whichever it is, that looks good?
Yes, brilliant, get it in. Otherwise, don’t. And obviously, wait for a structure break. So I never get in. I do get in occasionally without it, but wait for a structure break. Now I’m in. Aussie, New Zealand, I’m sure. OK, so to be able to do that, you need to be able to draw support and resistance zones effectively.
So there’s lots of different ways of drawing support and resistance. I’ve got a video on the website already and on YouTube about drawing support and resistance, which is in here somewhere. I can’t remember where it is. How to draw support and resistance properly to find turning points. And it’s based very much on lines. And the way I draw support and resistance is based on lines.
So if we get a blank chart, so we’re looking at something completely blank, and I’ll show you how I draw the areas in. So what I’m interested in with support and resistance is recent areas. I’m not looking for areas from ages and ages and ages ago, like back here. I am, but I will look at them closer to the time and I’ll show you why. So my immediate focus, whenever I’m looking at support and resistance, is where is the most recent?
And I only use four hour and hourly, yeah, or daily if necessary, but I’ll only use daily if I really, really need to use daily. So my focus is always on where we’ve been recently because the most recent support and resistance zones are gonna be the ones that are gonna be the strongest. Those are the ones that are gonna bounce from recently. And the whole purpose of support and resistance is it’s levels that the banks have moved to and for some reason stopped trading at. So it’s either a level where we have had as a target or it’s an area where we’ve entered positions. So the banks when they’re moving, which is again all covered in the training on the website, which is all free, and the videos about the bootcamp about how the banks move price, it’s all covered in there. But they basically move the market in one direction, then they take profit on that move, move it in another direction, then they take profit on that move, move it again, take profit, move, take profit, move, take profit.
And this is why we get market structure, because it’s the bank’s way of moving in an orderly fashion to make money. We get the odd craziness, where we get something happening in the market that we’re not expecting, like Liz Trust completely changing the way that our entire sector of banking and everything works and then suddenly going, ah, no, that’s not right, is it? So you get the odd crazy move like that, but that’s basically what the banks are doing.
So when I’m trading, I’m concentrating and focusing on hourly levels. And the reason I’m focusing on hourly levels is because when I’m trading prop, what I’m trying to do is to get in and out the market fairly fast with fairly small moves to build the account. So the way that I use Prop is I take multiple trades, multiple evaluations, and I will pass a percentage of those valuations. And then those passes, those funded accounts I get, I will try and trade them up to somewhere between 3 to 5K and then withdraw the money.
So I get them to a level where I want to withdraw, then I stop trading them completely. And that might take a day, three days, a week, or whatever. Depends on market conditions. I’ve got no control over that. Okay, so I’m interested in trading on the five minute and the 15 minute timeframes, but I’m looking for levels off of the higher timeframes, which is the hourly and the four hourly. So all I’m gonna do is I’m gonna draw lines at the most extreme points that I can see on the chart.
So in this case, it’s up there and it’s down there. Yeah, I’m going to need the ADR indicator on this. Whoops. For demonstration purposes, ADR reversal. Whoa. Let me just turn the alerts off in case anything hits. So there’s that high there, and then obviously this low down here, right? So that’s pretty much it for this one, extremes. We’ve had a big turning point there as well, so I’ll probably stick a line on that one as well.
So that’s the first thing to do, move on to the next pair, rinse and repeat. You can also go out to the four hourly, and I’ll go, okay, there’s another one up there. So that’s an obvious four hour turning point. We’ve got an obvious four hour turning point up there and we’ve got an obvious four hour turning point somewhere around there. And you notice how I’m not being accurate with this. I don’t really care. It’s somewhere around there in the market turn, somewhere around there it turned, turned up there, turned down there, turned down there, there. Yeah, so those are the lines. All I’m interested in is if we get to here and I get an alert on RSI or ADR when we’re down at this level, I will take a trade because this is a previous turning point, but it’s been rejected already. It’s been slammed through. So this is less valid than this one. So my focus is always on that one and that one, because these are the most recent high and low above and below where we’re currently trading. This is a recent turning point in the last day so I’m not as interested in that because this could just be part of market structure and we’re going to do that all the way up to there. Yeah so I’m looking for where we’re going we’re either going there or we’re going there. I have no clue which direction it’s going no one can predict the future.
It’s gonna go to one of those, right? So, because these are zones and they’re not levels, the market will not come down and hit it to the pit. Look at that and look at that. Are they the same level? No, yeah. Look at that, look at that, look at that, look at that. Are they the same level? No. Look at that, look at that.
Are they the same level? No. That’s not the same level as that or that. So support resistance is not a line. It will hit to the PIP. You will see it hit to the PIP. And the reason it hits the PIP is because the big market participants at that extreme will have limit orders set ready to fire. So what you find is you hit that and it goes boing.
But that isn’t necessarily where it turns. It will usually get a reaction to the pip, but that could be a reaction that big, that big, or it could basically not react at all. It could fly through it. We don’t know. So there’s no point in using a line. So what I tend to do with every time I draw a support and resistance area on is I would expand it out into a zone. There’s two ways of doing it. First is draw another line. So let’s just get rid of these higher lines for a sec and just concentrate on the most recent. Yeah, so this high here and this low there just to simplify it. A lot of people draw support and resistance in different ways. I like to draw it on the top there. A lot of people will draw it on the body, the last high body. Zooming in so we can see what we’re doing. Yeah, so there’s the wick, there’s the last high body, there’s the wick, there’s the low body, right? So immediately what you’ve done there is you’ve created a zone. There you go. So you’ve got support and resistance zone there. Yeah, so literally all I’m doing is watching when we get to there, I’m going to go short, and we get to there, I’m going to go long.
But only if I get a reversal alert from the indicator to tell me that there’s been a structure break. So I’m going to drop down onto my lower time frame, M15 or M5. I’m going to wait for a market reversal alert at that level. Let’s put the indicator on so we can see what we’re talking about. Yeah, so I’m going to wait for a reverse alert. So in this case, if this was, for example, a area I’d be looking to buy, I’m waiting for that reverse alert to trigger, which means that we’ve shifted to the buy side, and I’m getting in.
So those are the zones on the hourly. Now, what I will also do is expand these out by a distance above that zone. So remember what I said earlier, when we come to these areas in the market, we are not necessarily gonna hit them through the pip and come out of there or come off of there. What we’re gonna do is we’re probably gonna get a reaction at that level, which may trigger us into the market. But that reaction could be lower than the previous high or higher than the previous high.
Remember it’s somewhere around here, the market reacted last time. Somewhere around here is where we’re looking for it to react this time. But we’ve no idea at what price point it’s gonna happen. So there’s no way for us to go, I’m entering at that level exactly. What we need to do is draw an area where we’re going to think somewhere around here it’s going to react.
And that gives us an area to put our stop loss. So what I will then do is once we’ve got this zone in place, I will expand it to the upside by usually a quarter to a half an ADR. So ADR on this pair is 88. Half an ADR on it is 44. A quarter of an ADR is 22. So what I would do is I will measure above the very high around about, let’s say we’re gonna use a quarter in this case, 22 pips, which is roughly about there.
Yeah, so we grab our zone we’ve created and we just basically put roughly 22 pips more to the upside, something like that. I’m not accurate, I don’t care. So it’s somewhere around there, isn’t it? Yeah. So that is my resistance zone. So when we get here, if I get an RSI alert and I’m looking left and I go, right, okay, this looks like a good spot or we’ve hit ADR to the upside.
I’m thinking, yeah, that’s good for a short. I’m gonna basically wait for that reverse alert to trigger and it can trigger down here. It could trigger in there. It can trigger up there. I’ve no idea where we’re gonna get a reversal, but my stop loss is going to go above that area. Because what’s going to happen is, we’re going to drive up into that, and we’re either going to do that, happy days.
We’re going to do that, happy days. Or we’re going to do that, sad days, stopped out. So I’ve got to give myself room above the highest point that I’m thinking my resistance is going to be. The lowest point of my resistance area is usually a candle. So I don’t really pick anywhere specific that is going to be half an ADR, a quarter of an ADR below, but you could do. So what you could do is say, take the high line and go a quarter of an ADR above it and a quarter of an ADR below it.
This is the area that I’m looking to get into. So it’s a rough zone, never use a line or a specific level of price because price doesn’t do that. If you go back and look at price and how it reacts at different levels. So here, this level here, this exact point here, we pushed away from it, we were trading around, so what I would be doing at this point here, if I couldn’t see any of this, I’d be looking back and going, where’s the recent high and low? So there’s the recent high. Where’s the recent low? It’s there. Yeah? Look what happened when we came down to it.
We peeked through it. So if I was using that, getting my reverse alert, and then putting my stop directly below that low, I’m out. I’m dead. Extending below it by a quarter of an ADR or half an ADR, depending on how aggressive or whatever you are, then that is basically how you protect yourself from stop runs at support resistance areas. So that is where my stop goes, literally on that line there. Okay, so I’ve given myself now half an ADR of movement. The market stays within its ADR 58% of the time, right? I’ve given it half an ADR of movement.
That’s a lot of wiggle room on five minutes and giving you plenty of decision-making here, okay? And that stop loss there, I will then use to calculate where I’m gonna get out of my trades, okay? And all I’m using is a very simple one and a half hour target and what I typically do is I enter with two positions. I’ll enter with one position with a one and a half hour target. As soon as that’s hit, I will move to stop loss to break even.
Before you start slating me for, you always say in the live room, never use a break even stop, we’ve moved here 3 quarters of an ADR at least in our direction. If this thing comes back 3 quarters of an ADR against me, I do not want to be in it. It’s wrong, isn’t it? Yeah, don’t forget 58% of the time it stays within an ADR. If we’ve moved three quarters of an ADR back in the direction against where we got in, I don’t think we’re right.
So I’m getting out. What I mean when I say don’t use a stop loss break even is I’m in a trade, I’ve got this far, quick break even. Of course it’s going to come back and test, isn’t it? Yeah, if we’ve moved down to my target, no problem. Yeah, I’m out. I’ve hit target. And then I’ve got a runner. Now my runner trade is wherever I want my runner trade to be and there’s nothing wrong.
Let’s say, for example, we come up to here. Why not target that? Yeah, so taking one off there, target that. And then when you get that target, flip. Go the other way. Up to you. Targets, obviously, we’ve talked about, and we’ve talked about many times. Propulsion gaps are a very, very, very good target, obviously, to use.
So we use those all the time. I forgot WB. I haven’t got a WIB set file in here, that’s annoying. Let’s change the color of these. Powder blue? Is that lavender? Yeah, so these are great targets to use, obviously, as we know. Yeah, so this target down here is obviously still in play. So let’s say that was our entry. That was a previous level.
We got in here. was our entry, that was a previous level. We got in here, we had our stop there, our TP’s out, thanks very much. We break even on the trade, where’s our next target? Let’s try and get that propulsion gap. Yeah, so here, you know, let’s say that was our level. We got in, going down, where’s our target? Propulsion gap, yeah. So you can use any kind of targeting you like. But all I would say is your success rate with mean reversion and when you’re taking your support resistance trade you are looking for one of two things to happen. It’s either going to be a pullback on a long move.
In which case, then, you are incorrect on the trade. So if you only go for 1 and 1 half R on your target, i.e. you try to mean revert the move 1 and 1 half R, you will be successful way more. Get out with money. And the size of the stop here means that if you get a load of chop with half an ADR for two days, which we see over and over and over again, you don’t get stopped out. Then give it time to go.
So your strike rate is very, very high. My strike rate is well over 50% on my funded accounts that I use this strategy with. Yeah, because my stops are so wide. You see me at the moment, all these trades I’ve got running on the fibers. Still in the DAX. Oh, forgot to do that one. Let me just close that one out. I thought I put trading stop on that.
Yeah, you see me on these, look, the Aussie, let’s pick one, EuroCAD. So on this account, because I’ve only got one to 10 leverage on the fibers, unfortunately, what I’m doing on this account is I’m using a one ADR stop. So there’s my buy. Yeah, ADR on this pair is calculating because this empty five is terrible. We’ll just give it half an hour for this.
This is why I don’t use empty five as we know, until I’m forced. So ADR is 118, so you can see my entry is there and my stop loss is 111 pips away, which is what it was. ADR when I took the trade was 111, now it’s 118. But yeah, so that’s a one ADR stop. I’m still in it, because I haven’t been stopped out. Yeah. And you won’t get stopped out, yeah. So that’s how I draw in the support and resistance zones.
So literally the process is get an alert on the ADR dashboard or the RSI dashboard, go and have a look at it, Swiss Yen as an example. So again, have a look because we’ve got an ADR hit, which is up there, flip out to the daily. Are we at an area of support and resistance? No, brilliant. Next, Pound Swiss, let’s have a look at that. That’s an ADR hit. Hit to the upside.
Are we at a level of support and resistance? No. Fine. I’m sorry, this is a downward move. Yes, sorry. Right, we are. Brilliant. This is another support area. Yeah. Pushed up.
So this area here and this area here creates a zone, which we’re tapping back into. We’ve broken through previous resistance. We’re pushing, pulling back down into this previous resistance, which comes support. Support becomes resistance. So looking at the other chart that we had marked up here, look at how when we break through this level, look at how that level becomes support in the future.
And then resistance area again, potentially. Yeah, so price moves from support and resistance to support and resistance levels. That’s basically what it’s, it does over and over and over again, doesn’t it? So when you’ve broken out above a level, like on the Pound Swiss here, yeah, look at the highs, the recent highs. You can use these as your bounce points as well. And again, I would extend these out like that and have a stop loss somewhere under there.
Yeah, so stick a quarter of an ADR on it in either direction. David, being able to see the quarter and a half ADR, was that an update to the indicator or just? All right, this is my special one. This is me, my special ADR. It doesn’t do this, but use a calculator. 88 divided by four, 22. Rough, don’t have to be exact, yeah? Use a calculator or use your head, but it doesn’t have to be exact.
And what we’re looking for, we’re not looking for an exact figure. So don’t go, oh, it’s got to be exactly a quarter of an ADR, which is 21.74, so I’ll add it to 22, move it there and put exactly 22. Yeah? Roughly quarter to a half an ADR. And the other thing I would say is, when you’re doing these zones, look left. Draw a line on the top of this and look left. Look at these wicks here. If we’re going to break this level and push higher, where do you think we might find resistance?
A level that has been tested multiple times in the past. So we’ve got this level here as well. Yeah? And what we’ve done is we’ve tapped into it there. We’ve tapped into it there. We’ve come down, slammed through it, tapped into it, tapped into it, tapped into it, tapped into it, tapped into it, tapped into it, boom, through it, tapped into it, tapped into it. That is a very, very strong support resistance.
Again, basics of support and resistance. If it’s the more times the support and resistance level has been tested in the past, the stronger it is, or zone. Yeah, it doesn’t, not a level, remember, zone, support resistance zone. That’s massively strong, that line. And it’s 138.80. So I would probably say what that actually is, is 138.900 round number. Yeah, market loves round numbers.
So draw a zone around that or use that in your zone. So if we now go back and look at where we are, that little line there has been respected so many times in the past by price, isn’t it? So what does it make sense to do? Not use a quarter of an ADR. It makes much more sense if I can select the box because I’ve got so many lines everywhere, which I can’t select the box. Let’s get that out of the way. Give me the box. There we go.
Move that up to there. Give yourself an extra X number of pips. The difference between your stop loss being there or there, 17 pips in this case, in the grand scheme of things, doesn’t really make a lot of difference. We’re trading the hourly chart, yeah? This thing could do that for ages up here. 48 hours. Sit here for two days doing nothing.
And then boom. And the reason it will sit there for two days and do nothing, it’s because it’s resistance. What are we doing? We’re finding sellers. Yeah? That’s the reason we turned here before because the sellers took control. If they’re gonna do it again, we’re not gonna get through it, are we?
We’re just gonna sit there and get sold into and eventually they’re gonna go, oh, well, we can’t get any more, any higher boys. What should we do? Well, get out. Okay, bang, you win. So calculating your lot size on that, obviously you can use lots of things. There’s the, you know, you can use the price action toolkit to get in.
You can use the market reverse alerts EA. So with the market reversal alerts EA, literally all I’m doing when I put the EA on is I’m saying, get me in on the next short signal, right? And I will calculate roughly what stop loss I want to use. But what I tend to do is I have it set to half an ADR. Where are we? So I have the stop loss mode set to ADR, and I set it to half an ADR. TP, I set to 0.75.
So I’m going for 3 quarters of an ADR. And I’ll adjust these. So what I do is I let it get me in with half an ADR and I set it to alert me as well. So in the alert settings, I can never find the alert settings here. I set the pop-up alerts to true and I say, alert me on an entry. So I get a ping over there and my other monitor, which says you’re in a trade.
Yeah, so this will get me into the trade. So let’s say, for example, we get the reversal alert there. It will set my stop half an ADR away. I’ll basically just adjust that stop down to where I want it. It will set my TP three quarters, and I’ll adjust my TP to where roughly I want it, which is usually around about 1.25. And then I let the trade play out. Simple as that. But the simplest way, you know, I was talking about all these extra support resistance levels that you can draw in. So this is a good, this is more advanced support resistance. So that area there is a potential, that low and that high is a potential zone of, because we’ve broken through it, support. It’s a previous resistance we’ve broken, which becomes a support.
So that would be the continuation bounce I would expect to get, which is what we’re getting at the moment here on this one. So it’s a nice long, but this is more advanced. If you just focus on the highs and the lows and wait for it to get there. Yeah, you know, you’ve got 28 pairs. You don’t have to be in hundreds of trades. You just wait for it to get there, get in, and then take the trade. And you just do this on every single instrument.
But you don’t have to mark up. And this is the important thing about support and resistance. You don’t have to go through and mark all this up. I don’t go through and mark up every single instrument and go, right, I’m going to wait for it to get up to there, or I’m going to wait for it to get down to there, which is absolutely beautiful. Because you’ve got a propulsion gap, multiple lows, rejected. So this zone, this is a good example how I draw this zone in. I’m not bothering with lines, yeah? I don’t get, I don’t do lines.
I do zones. So I would go right roughly somewhere down here. Yeah, probably more below that low I would go. So where we are there, down to there is 29 pips. 34 is a quarter of an ADR. So somewhere down there, I would expect us to bounce. I don’t know where, I’m not being accurate, but that’s what we did last time, somewhere around there. Every time it was a completely different level. This time it’s gonna be a completely different level. I’ve got no idea where, but if it breaks down way below those levels, we’re gonna come down and invalidate the trade and off I go. But I don’t have to draw this in now because I only need to pay attention to when the market is extended.
I only enter trades when the market is exhaustion levels because after the market is stretched, it’s elastic band theory, which is taught in the boot camp. When the market is stretched, we’re expecting it to pin back. I’m trading that. So I do not get into a trade, ideally, do sometimes, but most of the time, when unless ADR is hit or extended, or we’ve got an RSI extension either on the four hour or the hour. So I don’t have to go through every morning and mark up my charts with support and resistance. All I do is I sit here and I wait for these things to pin and I go and have a look at them. First yen extended on RSI. Do I want to get in? Now I would be thinking actually here yes, not today at the moment because of what’s happened yesterday, but I like that as an area. I can’t pick any idea of where your stock loss would go on it, but this is a previous area of balance before a previous area of price discovery.
And I would look at a bounce out of there, stop somewhere under there. But from what I’ve just taught you, basically, that you would have marked up, that you would have marked up at the moment. So you’d look at this and go, nah. But the key takeaway from this support and resistance is it is not a level, it is an area and you need to give that area a really decent amount of room because you’re never going to hit it to the pip most of the time is price when it gets to these zones, if it’s going to make a run through the zone, it has to push hard. You need a lot of buyers because there’s a lot of sell limit orders sitting here. And this is why they work. You’re not the only person, bank or institution looking at that level. There’s a lot of people looking at this level right now, me included.
If we get back there, there’s gonna be limit orders in here somewhere triggered when we get back to this level. So it’s automatically gonna reject it because of the impure amount of cell limit orders that are gonna be sitting there, it’s gonna come out. The question is, is it gonna come out by a one and a half to one hour ratio? Most of the time it will, because by the time we get there, we’re extended on the RSI or the ADR, the market’s exhausted, the buyers are knackered, they’ve gone so far and so fast, they’re gonna find it hard to push through.
And this is why you find when you get to a support level or resistance level, it will fail the first time. The second time it will succeed because the first time the buyers got to it, they didn’t have enough momentum or orders left to break the level, so it rejected. They built up steam and drove back through it on the second attempt, which paints in what? Market structure. So what I’m banking on is a market structure pullback from support or resistance, and I don’t care if it fails or not. That would be lovely, and I get a runner if I take a runner. That will be, I don’t care. Why? Because I’m going for a small reward.
If you want to use a one-to-one, your strike rate will go up to 60, 70% by doing this. But the important thing is you’re just using support resistance levels that are extremes, the most common ones. This is a beautiful hit here. That high down to that low. We didn’t hit it exactly at all, did we? But the reason this is bouncing here is because this is a previous resistance, which hasn’t been tested.
It’s turned into support. But look how messy it was. Absolute mess. Sometimes you’re going to get this, and this is why you need to have your zones fairly wide. I mean, this one wouldn’t have worked. You’d have been stopped out on this. But then you can obviously expand your support and resistance to use multiple levels. So you can then start drawing in that one, you can use that one, you can use that one there, you can go down to that one there, those lows there.
But always, whenever you’re drawing your line, if you can see multiple areas where it’s touched, it’s going to be stronger. So there, there, there, there, this one, this one, didn’t touch that one, touched it nicely there. So that is an absolute beauty, that low there. If I get an alert down here, ADR extension, RSI extension, look at it, yep, lovely. Stick the reverse alert EA on, get me in, just get me in. I’ll work out the rest later, just get me in. And if you get me in, and it goes like that, and it hits TP before I get a chance to muck about with my stops and everything, whatever. You’ll win, innit? And you’ll get that, you’ll get these reactions here, because the reason they react so fast on these levels, look, look at that, speed of that reaction. So we hit it, and then we sat around for a few hours, bang. Hit it, sat around for a few hours, bang. Because basically it’s absorption of the sellers.
The sellers are coming down, the buyers are going, this is where we bought last time, we’re buying again here. And the sellers are going, we want to go low. And they’re going, no, no, no, we bought here, bang. Eventually these sellers just give up and it pops. So sometimes you get the reverse alert on you wake up in the morning, the trade’s already played out. Yesterday was a prime example of that for me. I made five grand yesterday. You’re doing exactly this. Yes, it was a bigger than normal market day yesterday, but every single trade was literally a support resistance bounce.
That was all it was. And an extension, yeah? So it was an RSI or an ADR extension at support resistance. Bias action happening at support resistance. It’s literally all it is. Okay, there you go. It’s simple, isn’t it? Patience and just waiting for it to get to those levels. There’s a few questions coming, so I’ll answer those questions.
What are the lot size to use and when to use them? So I use a half a percent risk. So every trade I take is a half a percent. So on a 100K account, I’m risking $500. Yeah. If I take two trades, I am risking a quarter of a percent per trade. But it’s entirely up to you how aggressive you want to be. Yeah. So for example, at the moment, E8 has an offer going on.
I posted it in the Telegram group yesterday. There’s a 15% offer on E8 at the moment. So if you want to trade with E8, they don’t have a minimum day, minimum trading day, right? So if, for example, we’ve, let’s say we, let’s go into the past, let’s do this. In a way that, so we’re here, right up here. Yeah, we’re popping down, popping down, popping down, bang. We’re in the zone, yeah, M5, you’d have had a reversal alert on that candle there. Yeah, this is an hourly candle, so in there somewhere there’s a reversal alert.
So you’re in, you’ve taken a long, you put your stop there. If you use 1% per trade and you’re using a 1.5 R return, yeah, you’re going to get obviously 1.5% back on that trade. It’s more risky, but you’re going to take fewer trades using this type of approach because you’re waiting on the hourly timeframe for the market to move there. And the market can take days to get to these zones, but when it gets to them, it’s exhausted. We’ve got an RSI extension most of the time, either on the hourly or the four hourly by the time we get to these zones.
So when you get to them, they’re absolutely exhausted. So if you get in with 1% risk, look at the size of that. The chances of you getting stopped out, there’s more chance of you sitting in the trade for 24 to 48 hours than there is you getting stopped out. If you get stopped out quickly, fine. You’re just an unlucky trade, isn’t it? You can’t do anything about it, so you’re out. If you’re getting the 1% risk there, and you’re making 1.5% a trade, if you’ve got a target of 8% on a prop firm account, you only need five trades to work.
Yeah, 28 pairs here. If the first five you take, and bear in mind you’ve got a nice big half an ADR stop loss on this, the first five trades you take work, that’s a pass. You can do that in a day. I made five grand yesterday on a 50K account. That’s 10% return. One day. Easy. Using half a percent risk. Imagine what I’d have made if I used 1% risk.
But I want to keep my risk small, so I would recommend half a percent. But if you want to get in aggressive, yeah, and with E8, because you’ve got no minimum days, if you take three trades with a 2% risk on each trade, yeah, the chances of all three of them failing is quite remote, yeah. I mean, I don’t often get losing runs with three to five trades at a time. They do happen, they will happen, they will blow your account, which is why using 2% risk is more risky. But you’ve got a 5% drawdown allocation daily. You’ve got 10% on the whole account. So if you’re getting with 6%, right, in three trades, and two of them do that, one of them gets stopped out, all you’ve actually lost is 2% on the day.
So you’re down to 8%. The other two fly, yeah, they’re making you over 5% on your account. You only really need two to three trades to pass an evaluation, don’t you? But they are high probability trades because you’re waiting for the market to get to these superb levels. Now imagine, so let’s look at this one from a risk reward ratio perspective. So you would have gotten somewhere on that candle there, yeah?
Stop below that low. Whoops. So let’s say you’ve got a 55, 56 pip stop. So 56 times 1.5, one and a half hour return, 84. So there’s your target. There, so you hit target basically within 24 hours. Two to one, what did we say it was? 56, so 100, roughly, 100 and something. So there’s a two to one. That’s a three to one.
And look how much movement that is. It’s hardly anything, is it? It’s just a pullback on a potential drop. Yeah? That’s all you’re looking for. But what everybody does wrong when they use support and resistance, and this is the reason I wanted to do this and explain how I do it. The way that everybody goes wrong with support and resistance is they draw either a line there or a line there and they wait for the market to get to this level and they get in with a stop like that, you’re going to get stopped out. If you’re using small stops, what everybody’s trying to do on prop and any trading, even if you’re trading with your own funds, you’re trying to get the best possible tightest stop so you can make the most money. Do you ever hold a trade? No. Very few people can hold on to trades.
Human nature, when this thing gets… You’re risking $500 on that. When this thing’s $500 in profit, your entire being is saying, bank it. And you do. And then all of a sudden, you have a 45% strike rate and you’re negative. Yeah. Use a wide stop. Give your trade an opportunity to play out and not get stopped out.
And you’ll find your strike rate will go through the roof because you’re not allowing the market to take you. You know if you know me well and you’ve been in my live rooms for a long time you know that I don’t use stops, I position trade. The reason I don’t is because you get stopped out all the time. As soon as you put an order into the market that says take me out of the market with a loss, the market will take you out with a loss. Why? Because you put an order in there to tell it to do so. If you don’t use a stop loss you won’t get taken out the market and if the market comes against you and you take a second and get in again you’ll just make a profit position trade and that’s what I do on a daily basis that’s what I teach in the live rooms but in prop you don’t have that flexibility to go into seven to ten percent of drawdown to get that 15 20 percent return a month do you so what you have to do is use a stop and this is where everyone goes wrong tight stops if I get in here with a stop loss there, and I can get a two to one with a 2% risk, I can pass my evaluation today.
You’re only giving yourself one shot. Give yourself room. Market is not going to just go, oh yeah, okay, there you go. It’s gonna do that. And you’re gonna think, oh, this trade isn’t working. And then you’re gonna go away, you’re gonna make a cup of tea, you’re going to walk the doggy and come back and you’re going to be up there. But if you put your stops too tight you won’t get it. So when you see any resistance like there, expand it. And half an ADR, you know, if you want to be super swingy, half an ADR. Go 70 pips or the other thing you can do is which I wouldn’t recommend use the use the high right and then just use a zone above the high of half an ADR for your stop loss or quarter of an ADR whatever you want to use the problem with this is you will find a lot of the time what the market will do when it approaches a support resistance is it will get there and it will turn without actually touching that level.
And that is what we call an uneven stop run. And typically what it is, is market structure playing out. So we go high, low, lower high, lower low, or we’re forming part of a symmetrical triangle pattern in a contraction. Either way, if you don’t get to that high, you miss that trade. By expanding around the resistance area by half an ADR or quarter of an ADR, you will make sure you always get into that, but you give your trade room to breathe, yeah? So all those ones where we come up and do that, you will get those trades.
And they’re quite often the best ones because we’ve bearish, we moved here. Yeah. So when we come up and test that, the sellers go, no, no, no, we’re short. We’re not going to let you take our liquidity. You get out of here, you go short. Yeah. So hopefully that explains that. Anyway. So that explains what to do with the lot sizing. But that’s me personally.
Lot size is a personal choice. Personally, when I get my funded accounts, I keep my exposures fairly small per trade. You know what I’m like with exposure. I don’t like to get overexposed. That’s why I have the trade manager dashboard because it monitors my exposure and tells me when I am overexposed. The Canadian dollar goes up today, I’m in trouble. Yeah, so you got to keep on top of those things.
Just going to go through the chat. Coco, I hope always by your side, just got back from the gym. What should I get in? I don’t know, anything you like. Today’s chaos day, basically. We’ve got the European rates announced this afternoon. So whatever you get into, it’s all going to go mental this afternoon. My advice, nothing.
Go and do something else until 1.15 this afternoon. If you’re allowed to say 5% drawdown with the prop company, what percent are you risking per trade? Oh, we’ve covered that once you’ve asked the same question there, yeah. So I’m risking half a percent. But again, up to you, 1%, 2%. If you want to, I use the one hour chart because it gives me more opportunity. If you wanna use the four hour chart, use the four hour chart.
Yeah, so you could use the four hour for recent highs and lows. Obviously, four hour high is there, four hour low is there. So think about how long it’s going to take to get there. Let’s put the period separators on so you can see time. Each of these is obviously a day. I’m sorry, it’s a week. So, you know, let’s say that’s the high and that’s the low. It took one, two, three, four, five, six, seven weeks to get there.
So it’s a lot slower. So if you’re going to use the four-hour time frame, what I would be doing is looking at potential support bounces from previous resistance as well. So I’d be looking at that level there. Yeah, come back down. Whoops. Yeah, come back down once and look at that level. And maybe put a zone around that and say, which is exactly what works.
So there you go, it’s a prime example. I didn’t realize that was there. So this level here, yeah. So draw your zone around that level there. So 38 pips is a quarter of an ADR, which brings you pretty much where it is, 36, 38 pips, something like that. So there’s your zone around that high. Anywhere in here, which that is exactly what we tapped into and bounced out of.
That’s a prime example of what I was just saying about, yeah? You are not going to get to that high every time. Sometimes it’s going to fall short. If you’re doing a previous resistance turn support bounce, it’s not going to get to that level necessarily before it bounces. It may well come back down now and do that, which is fine. You could get into it twice. Just because that zone has been used once doesn’t mean it won’t be used again, does it? What’s that? Support. Any reason why that wouldn’t bounce again? No. Use that. Use whatever you want. But just the key is how you draw your support and resistance is entirely down to you. Everybody’s going to draw it differently. If I give 10 people the same chart and say, draw me support resistance, I’ll get 10 charts back with different levels and different zones on it.
The key is expanding around the zone because you don’t know whether the entry is going to be above, below, and if it slams through it, it’s dead, not using it. Yeah. So if price now goes like that, what’s it going to do? Probably that. Yes, if it’s gone through it, it’s gone. Not in use anymore. Scrap it. Didn’t work.
And that happens as well. You will get through a zone without getting a reversal. What do you think of position part closures at target? I don’t, personally, I don’t use partial closes at all. I mean, I’m out and I’m hitting target or I’m stopping out. But as I said earlier, I will use two positions. Most of the time what I do is I get in with two positions. So you get in there, I’ll get in with one position there and I’ll add another position of the same. So if I’m using 0.5% risk, I’ll have two 0.25% positions.
One of them will be one and a half ADR. The second is a runner. There is no TP on the second. It’s where the hell can we get to? So as soon as I hit target on that first one on break even, and then I let the runner go. The problem with doing this, which is a problem and will sometimes what I find with my prop accounts is I will have a prop account that, and this one that I’ve just shown the screenshot of yesterday was exactly the same.
It went into two and a half K of drawdown over a good week and a half, that’s 14 days. It took me to get the target hit on that one. So for a week and a half, I was going like that with my P&L. The reason was, was because I was taking two positions, yeah, and getting out of one at one and a half R, and then the second one will come back and not get me out. So what I’m doing is I’m risking half a percent and taking a quarter of a percent, 0.75 percent, sorry, no, 0.33 percent profit.
So my risk-reward ratio is negative. It’s a more advanced, what I would recommend is just get in with a percentage, set a TP and get out. Yeah, if you’ve got a 1.5 R and this edge to edge support resistance has a strike rate above 50%, with that one and a half R, you will make money. Yeah. Jonathan, I just noticed the culture of posting the highest risk to reward rates, 1.25 to 1.5, et cetera. A lot of these people posting are just showing charts they mark up after the event, never show closed P&L. Yeah, exactly. So that’s my closed P&L.
This exact strategy that I’m showing you now is this exact P&L. Look at every single one of these trades on here. Look at the profit. This is a 50K account. That’s a 10% increase on the day. This is only one day, isn’t it? But you see some of these trades, I got into that on the 7th of March, and I got out with nothing, Aussie US, on the 15th.
I was in it for a week. All it was doing was that. Oil, got in that one yesterday, I got out of it within an hour with $500. But look at all these profits, yeah? $170, $300, all my losses, look, are 115, 116, 118, 115, 116, 137. All my losses are what? Half an ADR, yeah? $250 is my loss, half an ADR, that’s all I’m ever risking. What I’m getting back is 176 on 118.
I’m getting a 1.5 return on my risk on all of my positions. But my runners, 231, 230, 230, 415, 222, 491, 518, my runners make me a really good amount of money. Yeah, but that’s the P&L. So yeah, there we go. Let’s just see if there’s any other questions before I disappear. I need to learn more. Okay. Will the news have any impact on oil?
I’m not doing any analysis at the minute. We’re just waiting till we finish this support and resistance. Is there any more questions on support and resistance? If you’ve got any more questions on support and resistance, give them to me now. I’m doing well with position trading. Not talking about position trading at the moment. Okay. That looks like all the questions.
So that’s it. So that’s the support and resistance. So hopefully that helps you if you’re in prop with a stop loss strategy. So still concentrate on extensions. That’s the key takeaway from this. When we get to a support resistance level, I want to be extended. I want to be an RSI extension. So that’s what I’m using as my signals.
Get me in, like have a look at these when you get these signals. Yeah, ADR extensions, RSI extensions, there aren’t any at the moment because the market’s a bit wobbly. But when you get these alerts, go and look at the charts. Are we near a support and resistance level? If we are, mark it up, put the EA on, or, you know, put an alert in if you want to. Take the trades, yeah, but give them room, room.
It’s the key, room. They need to breathe because support and resistance is not a single level. Okay, good luck with that. And if you’ve got any questions, always come in the Telegram group as usual. There’ll be links in the description for the Telegram group. And obviously, I’m around the website as well.




