
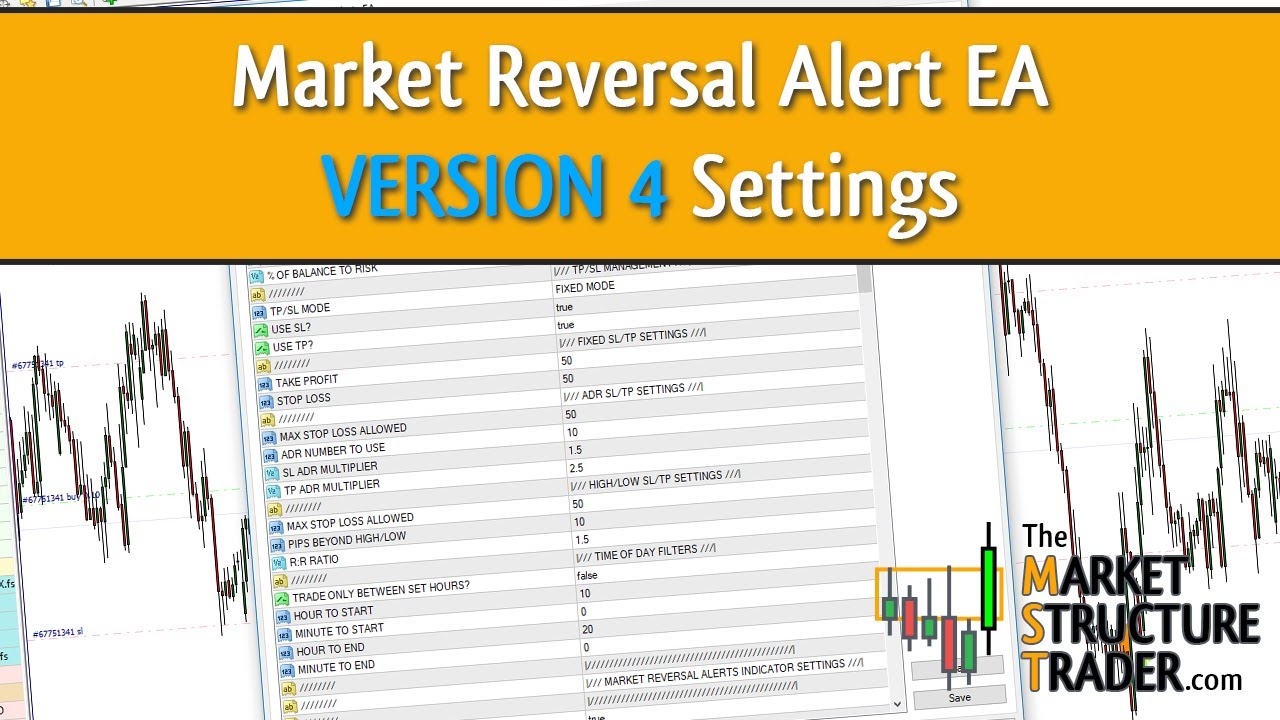
This is the Zoom session introducing the new options for version 4 of the market reversal alerts EA. There is a lot more strategy tester information in this video too, showing you how to effectively back test and develop strategies using this or any EA.
👉 Market Reversal Alerts EA To Automate Your Trading: https://www.mql5.com/en/market/product/65383
👉 All Indicators Used On My Charts Are Available Here: https://themarketstructuretrader.com/the-indicators/
👉 The FREE Position Trading Bootcamp Course is Here: https://themarketstructuretrader.com/category/the-position-trading-bootcamp/
👉 Join Me & Position Trade Daily For Free In The Live Room Twice a Day: https://themarketstructuretrader.com/the-live-room/
👉 Join The Community Chat on Telegram Here: https://t.me/market_structure_trader_chat
Video Transcript
So Right, okay. I’ll get started then. Right, so this video is going to be basically an of the EA settings so that you’ve got a good understanding of what everything does. And obviously, like I said, the reason behind this sort of Zoom is just to give you an overview of why those settings exist and the strategies behind them so that you can start doing some more detailed backtesting and sort of try to replicate the strategies really and fine tune them.
So I’ve got some set files set up just to give you an example of what it’s doing and how it’s working really. But I’ll start off by going through all the settings. So what I’ll do is I’m going to put a blank chart up. Ignore mine, this is version four. This is version 4.1, which is coming out very soon. I won’t go through version 4.1. There’s only one change in it, but it’s a big one. So I’m not gonna talk about that now. We’re gonna look at version four, which is this one. Okay.
So let me just stick it on the chart. So the inputs, let’s have a look at all these inputs. So starting at the top, basically, actually starting with what the EA actually does. Let’s do that. So the EA basically is built on the market reverse alerts indicator, which is this here. And basically what this does is it signals to you when there is a shift in market structure.
So let’s pick another pair. It’s got a better structure, there we go. So as price pushes down and pushes back hard in the opposite direction, we get an alert. You see there’s one there as well. And when price pushes back up and further down, you get a retest alert, which is indicating the formation of a potential M or W pattern. There’s no retest down there, obviously, but this one has got a retest.
So you can see that’s forming an M pattern, which is a reversal pattern. So M and W patterns are reversal patterns. And this is what the indicator is mainly doing, is it’s designed to show you when there is weakness in one direction and strength starting in the opposite direction. So just to go through the settings of the EA quickly, first of all, there’s quite a lot of them. Version four features are all at the bottom, okay?
So for those of you that have got the EA already or have or know of the EA, all the version four features which have been added are down here. There’s a couple of tweaks to other areas as well, which I’ll go through, but this is the main differences for version four. Okay, so starting at the top, trade direction. This basically is defaulted to both signals. What it will do is obviously trade in both directions. So every time you get a reversal alert based on whatever conditions you’ve set up, it will take a trade either long or short.
You can decide to take either long signals or short signals only as well. The reasoning behind this input is if you are, if you have a trend bias on a particular pair, for example, I wanna go long only on Aussie dollar yen, you can put the EA on the chart and say, I wanna take long signals only, okay? So it will just basically get in on longs because your bias is long. It’s not something that EA has decided that the bias is long, that’s something that you’ve decided. The EA mode is either trading mode or alert mode. This is something that somebody asked me for basically. Obviously EA is designed to trade. They’re designed to automate a trading strategy, automate an indicator, and just basically get you in and out of the market based on specific conditions.
Some people wanted to use the EA as a indicator as well. So I put a alert mode in, and all that will do is rather than taking a trade based on the conditions that you set, it will pop up an alert. And to have that working, you need to down here in the alert settings have generate an alert at entry or exit or both and select the type of alert you want, pop-up, email or push, okay?
So if you don’t have these set, obviously it’s not gonna work so if you’re gonna use alert mode, make sure that those are set as well but this isn’t what it’s designed to do, it’s an EA, it’s designed to take trades so obviously most people are gonna leave it, in fact everybody that I know is leaving it on trading mode. Trade comment, this is basically whatever you want to put in the comments. So when you take trades, this is the comment, mean reversion trade, reverse alert CA, whatever you want it to be. So you can set as many comments as you like. You can choose whatever comment you like. If you’re setting up on multiple pairs or on the same pair with multiple times and you want to execute different strategies on there.
That just allows you to basically specify which each one is. So you can easily see in your trade list and in your obviously P&L, what that particular trade was. So that’s all that is, is the trade comment. You can change that to obviously whatever you want it to be. Entry method is set as default to initial reversal alert. The initial reversal alert is this, obviously there. So where the candle breaks down, that is the initial reversal alert. You can also select the retest alert, which is that arrow there, okay?
So the initial reversal alert or reversal retest. And that will decide whether or not it takes that initial one or it waits for the retest. Obviously the disadvantage of waiting for a retest is a lot of the time you will find that the market will just fly in one direction and it won’t do a retest. And that one did, let’s zoom out a little bit. Just trying to find one that hasn’t got one on. There you go, so this one obviously got the reversal alert and it never came back and retested, it just flew off.
Whereas this one, we got the reverse alert and the retest. Okay, so that’s what that does. Whereas this one, we’ve got the reverse alert and the retest, okay? So that’s what that does. And that’s to do with the market reversal indicator. Obviously, so if you’re familiar with the indicator that powers the EA, this is all just standard stuff to you guys. Magic number, every single pair that you put the EA onto has to have its own unique magic number for buys and for sells.
So you can have one and two, for example, for this version. And then if you want to put it onto the next chart, the next chart, you would use three and four, five, six, whatever numbers you want to use, but they have to be unique. If you hover over any of the trades that you’ve taken, you’ll see there that it says, placed by expert ID 26, placed by expert ID 26, placed by expert ID six, et cetera.
All right, so hovering over your trades like that will show you the expert ID and that is basically that number that you see there. It has to be unique for a long and a short within every pair that you put it onto. Close trades in opposite signal, that’s set to false as default. Setting that to true will basically close your trade when the RSI 14 is above 68 or below 32 the EA will take that trade obviously and trade however I want it to. If I set this to close the trade on the opposite signal let’s say for example, there’s our RSI, there’s our 68 and our 32 level. If we get in here, the EA will not close the trade until you get a reversal alert above the 68. So the conditions that you have set, the filters that you have set in the EA, the opposite of them has to be true. So it’s not just just get me out when the next reversal alert happens. So when the next reversal happens here, that isn’t what that setting is.
There is a new setting for that, which is down here in version four. We’ll cover this now, we might as well, while we’re talking about it, which is close order in opposite alert. And basically what this will do is regardless of what you’ve got as your entry criteria, as soon as you get a reverse alert in the opposite direction it will just shut that initial trade. Okay so this is really useful for people that want to have an always-in strategy so what you want to do is for example on the four-hour time frame um let’s say so let’s say you want to get in on a reversal alert and you want to get out on the next reversal alert and go the other way.
Yeah, so in this case here, you’d have got in here, traded down, and you’d have got out there, and then you’d have got in long there. So now you’re in long. So you’ve won that trade, you’d have got out there, and then you get in that trade. Okay, so that’s what that is for. So this, just to clarify, I want to really clarify this one, because this is something people get confused with. So that setting there for close trades on opposite signal, all conditions in the EA have to be met to get you out. This one, it will just get you out as soon as there’s a reversal alert on the timeframe you’re trading, it will close that position for you. Okay. Style of trading, market order or pending order. So it’s set to market order as default. So as soon as you get a reversal alert, it will immediately place the trade.
If you select pending order, it will place a pending order for you, this number of pips below or above the alerts. So, let’s wait for that to load. So we’ve got an alert, which happened up here. Okay, so we’ve got that alert there, for example. So if you had it set as a pending order to enter 10 pips, and what it would do is as soon as you get that alert, it would place a pending order 10 pips below that line. Yeah, and it wouldn’t trigger it until there.
Okay, so that’s all that one does. Pending orders have a use. In my opinion, market orders tend to be best, but it’s entirely up to you. You can play with the settings, but that’s basically what that one does. Money management, next bit. So there’s a bit of a change in version four to do with money management. So obviously using balance or equity is very straightforward.
It’s either the balance or the equity of your account. And the difference between the two is obviously down here. So your balance is that, your equity is that. So this is what is actually closed in your account. This is what your account is minus your drawdown. So my drawdown at the moment on this account is 23. So obviously this is 23 pounds less than my account balance. All right. So very straightforward. Lot sizing, you can either use fixed or percentage.
So fixed lot sizing is basically this here. So a fixed lot size. So it will take every trade with a 0.1 in this case. You change that to whatever you want it to be, a 0.01 or 1.5 lots, whatever. It doesn’t matter what you said in there, that would just take a trade at that. Your fixed, oh, sorry, your percentage will use your account balance or your account equity, okay? And you will risk a particular percentage of your account.
Okay, so account balance to risk 1%. So what will happen here is it will use the stop loss, okay, and it will calculate the lot size dependent on what you want to risk. So for example, let’s say we wanted to take a trade here and we wanted to use the high there, okay. So what we would do is we would use high-low mode for our stop loss, which is here. So our high-low mode, we would say, let’s put it one pip above the high. And what it would do is it would calculate what your stop’s got to be there and work out the lot size for you based on that size of stop.
Yeah, and obviously, it will use whatever you’re setting. So if you use ADR mode, it will work your stop out based, in this case, on half of an ADR. If you’re using a fixed mode, it will just work it out based on your fixed stop loss. Yeah. So that’s percentage and percentage of balance. Obviously we quickly covered the stops and TPs there, but stop loss and TP management, you have multiple options. You can either have fixed in PIPs, you can have ADR, which is the average daily range of this pair.
So the average daily range, let me stick the dashboard on one sec. So the, sorry, wrong about the dash. The dashboard is now split into multiple parts. OK, so the ADR on this pair is 81. So using this setting here for ADR, it will use half of an ADR. So my stop will be, in this case, 40 pips. So if I set it to 1 ADR, the stop will be 81 pips. So it’s based on the average daily range of that pair. And you can change the ADR number.
The ADR number is the 40 to 10, which is the 40 to 10, which is the one that I’ve done all my analysis on, which is the best, which is the last two weeks. And obviously, you can change that if you want to. You could use 14, or some people like to use 5 or 7. But 10 is kind of what I’ve found to be the sweet spot. Your TP, obviously, you can set that independently. So you can use ADR mode. You can use high-low mode, which is obviously where it places the stop above the high or below the low.
And you can use independently those on each of your TP and your stop loss. They’re set to true as default. If you don’t wanna use a stop loss or you don’t wanna use a TP, which is typically used by basket traders, position traders, then you just set those to false. Yeah, and it will just ignore those. All right. So I’m gonna quickly cover now one new setting in version four, which is to do with stock loss.
Okay, so the problem we had with the previous version, not so much a problem, just a limitation it had, was that you couldn’t use a percentage of your balance if you were using position trading, because in position trading, typically you don’t use a stop. So there was no way to calculate the lot size with the EA. So what we’ve got now is a new setting in version four, which is basically called fake, use fake stop loss to calculate lot sizing.
So if you set this to true, what will happen is it will place a stop in the market. So you need to have stop loss set to true as well. Select the type of stop loss that you want. And I use ADR most of the time. So I’m going to say 0.5 ADR. So what it will do is when it places a trade, it will place your stop loss in the market at half an ADR and automatically calculate the lot size. You can see the next long lot size here is set to be eight.
Yeah, so if it gets in the market, it’s gonna take a trade at 0.08 for me. That will change depending on what you put in the settings here, but then as soon as the trade is placed, it will delete the stop. Okay, so it just uses the stop loss management to place the trade and calculate the lot size for you based on account balance as a percentage in this case. And it’s gonna risk 1%. And then it will delete the stop.
Yeah, so it’s just a way of using a percentage of your account to get in with your lot sizing. All right, so all you’ve got to do is set use fake stop loss to calculate lot sizing to true and then just set up your stops as you want them to basically work. Okay, these are pretty self explanatory, TP and stop loss management. So we’ve got fixed TP, yeah, which is using a bog standard PIPs basis.
So 20 PIPs, 40 PIPs TP. ADR uses the average daily range of the pair, as I just said. 81 pips in this case. So you would get in with half an ADR. So if you set half an ADR as your stop loss multiplier, and you set ADR as your TP as well, what that will do is it will get you in and it will use half an ADR stop loss, 40, and it will use one ADR, 81, as your TP. High, low, and that is obviously when Yeah.
High, low, and that is obviously when you get a reversal alert, it will place the stop above the high. And you have a risk reward ratio to use on that. So if you had your stop being set at a particular level, so let’s say we said one pip above that high, it would measure that and see how many pips that is when it got in. Sorry, the entry would be there. If you had a one to one risk reward ratio, your TP would be set there. If you had a two to one, it would be somewhere around there.
And so on and so forth. So that uses a standard stop risk reward ratio. And this is your risk reward ratio here. So you always want to have a minimum of a 1 and 1 half risk reward, ideally, on any strategies that you use to make them positive if you’re going to use a stop loss, otherwise obviously long term, it becomes difficult to make money. You also have a max stop loss allowed limit, which is defaulted now to 9999.
What this does is if the stop is above this level in PIPs, it will not take the trade for you. So this is designed to help you not get into trades when you have very, very big candles. So sometimes you’ll have, let’s say this here was a massive candle on news like that. Yeah, and it gave you a reverse alert and it got you in there. Your stop, if you’re using high low, may well be up there. That’s a massive stop.
So your risk reward is gonna be way down there somewhere, absolutely miles away. So that max stop loss is just designed to give you a little control over those massive propulsion candles that you get in the market where you don’t want to get into those trades because the stop loss is way too far away and the risk reward is going to be very difficult to achieve. And you can use that with the ADR or with the high-low.
The main difference is these are now defaulted to 9999. In the previous version, they were defaulted to 50. And a lot of people were DMing me saying, the EA’s not taking trades, why? And 90% of the time, it’s because they had one ADR as their stop loss and 50 pips. And of course, the ADR on this pair is 81. So it’s never gonna take a trade because it’s always saying, I need to put my stop loss 81 pips behind me and I’m not allowed to do it above 50.
Yeah, does that make sense? So that’s basically what these are set for. Okay. Time of day filters, self-explanatory. This works off your broker time. So only trade between specific hours of the day. Main purpose for this is to stop broker candles, stop taking trades on broker candles. So I will show you what I mean by a broker candle. So you see here, let’s zoom in a little bit, let’s just find a better one.
My broker is terrible for them, so we’ll find some decent examples here guys, a really good one. Right, so market closed here. Yeah, my broker decided to open the market all the way down here. Yeah, so he decided to widen the spread by 16 pips, almost a quarter of an ADR in one candle. So you’ll find a lot of the time when your broker does this on the swap, when we change over every day, what will happen is you will get a market reversal alert on this candle because this will be so far away from where the actual close of the previous day was, you won’t be able to get in. And the spread will be absolutely massive. They’re just horrible, horrible trades to take. So the idea of that time filter is to stop you getting in on these trades. And I can show you them pretty much every day.
Close there, open there. Yeah, closed up here, opened down here. In this case, he decided to widen by 16 pips again. Close, open, yeah, almost every day. You’re gonna find there’s gaps. And sometimes you’ll find they are massive. I think in the live room, Peter will probably testify to this. In the live room, I’ve seen gaps of 30 to 40 pips. And basically what they’re doing is they’re taking your stops.
So they widen the spread so far and they just basically grab a load of money. I won’t go into the intricacies of it because it isn’t about that. But that’s basically what’s happening. So you see that’s just taken a trade just because I asked it to buy stop set up. So I want to take that trade. Let me just cancel that off. Don’t want to do that. It’s a live account. So yeah, so that’s basically what the time of day filter is for.
While I’m talking about those horrible nasty broker candles, we now in version four have a new setting as well, which is the spread filter. So you can now have a spread filter. And again, I would set this as something like five, really. It’s set to 10 as default if you want to use it. I don’t know who your broker is or what your broker spreads usually are, so it’s set fairly wide. But what typically happens on the run-up to the changeover, to the swap, and just after the swap is you have massive spreads.
And also around news, obviously, just before news you get these big widenings of spreads. So the spread filter basically will stop the EA trading if the spread is absolutely massive. So at the moment on this, I’ve got a spread of 1.6. Yeah, here, you’ll have a spread of 10, 12 pips. So if we get a reversal alert and the spread is over five pips, don’t take a trade because I don’t want to. The only reason the alert has been triggered is because they’ve widened spread so far unrealistically.
Okay, so that’s those. Market Reverse Alerts Indicator Settings. If you’re familiar with the indicator, you’ll be familiar with all these. Basically, there’s videos on YouTube and on the website at themarketstructurtrader.com, which go into details about the settings on the Market Reverse Alert Indicator app. So I don’t really want to go into them in detail here. I’ll quickly skim over what they are. But there are other videos you can watch, which will give you much more information on those. Okay, so use WIX to the left of the candle. So it will either use the WIX to the left or not. And you’ll see examples of that. If you look in the manual as well for the EA, there’s screenshots and examples of what those mean.
Aggressive mode gives you more alerts. So you can set that to true or false. Number of bars for retest. So when you get the alert, it’s the number of bars counted before it says yes, I will do a retest alert here or retest arrow. Again, there’s more information on the website about that. Higher timeframe alerts. So you can take trades just in the direction of the last reversal alert on H4, for example. So this is the four hour reversal alert drawn. So you can see here, it says the higher time frame filter is in the up direction.
So the EA will only take longs. So for example, here, if we push up here, it will take a long trade for me. But if we push down like this, it wouldn’t have taken a short because the higher time frame is saying we are going up. So we’re taking longs. All right, so that’s basically what that is. But again, it’s explained in much more detail on other videos on the website and on YouTube.
So go and have a look at those if you want to find out more about that. So those are the settings for the indicator itself. Then we come onto our filters. So the RSI filter basically is pretty self-explanatory. RSI is the main indicator I use for measuring market exhaustion and market movement. So that’s why these are in here, because most of my strategies revolve around relative strength and exhaustion and mean reversion. So the RSI filter, let me just stick an RSI. Okay, so this is the RSI. Probably familiar with this one already.
But the RSI basically, this is the RSI filter for your timeframe. So in this case, we are on the M15 timeframe. So what this is doing is it’s saying, if you set this to true, I only want to take trades when the RSI 14 medium, you can set up the, whatever you want to with the RSI, the type of RSI that you want to use, when the RSI 14 is either above the 68 level or below the 32 level.
So the theory being obviously when the market pushes hard in one direction like this, when the peak of that move is above the 68 level. I’ve got 70 marked here but 68 be about there. And you get that take a short. If you get an alert now, for example, and it hasn’t gone below the level, it will not take a long. So what we’re basically saying is I only want you to take short trades and long trades when the market is pushed very hard in one direction or in the other direction. Yeah, so that’s what that one does. Sorry, that one. The higher timeframe RSI filter means you can basically set a higher timeframe RSI to be extended.
And you only wanna take trades when that is the case. And this is one of my core strategies. So I trade with the four hour RSI. So you can see on here, we’ve got the RSI H4 is at 63. So if you flick over to that, you’ll see that one’s sitting, last closed candle is that one there. So that was sitting 63. So what I like to do is when the RSI on the higher timeframe, because I use multi-timeframe analysis to trade, when the higher timeframe RSI is extended, I start looking for short opportunities.
So what I would be doing is saying on the EA on M15, when the four hour RSI, higher time frame RSI, four hour 14 is extended above 68, start taking short trades on the M15 timeframe. Yeah, so that’s basically what that filter is for, okay? is four. Okay. Obviously you can use the same settings for RSI with this one as you can with all the others. If you’ve got any questions on any of these, obviously we’ll cover them at the end, but I’ll just skip over them now, just so you know what each of these settings is actually doing and showing you.
And that shows up obviously in the dashboard as the RSI normal one, and the RSI of the higher timeframe you’ve selected. So you can see where they, each of them is. Moving average is the same thing. So you have a moving average filter. So you can say, I only want to take trades when the reversal alerts happen above the 200 moving average in this case. So let’s take an MA on the chart.
So let’s use the 200 MA. Okay, so in this case, what we would be saying is if the moving average for this particular timeframe is the 200 exponential, which is this one here, if we get reversal alerts in the upward direction, so buy signals take a long, if we get short signals, don’t trade. Yeah, and the strategy and the theory behind this obviously is moving averages support price. So when price is below the moving average, we’re in a downtrend.
When price is above the moving average, we’re in an uptrend. So that’s basically what that is doing. It’s allowing you to filter your trades by the moving averages you select on the current timeframe that you’re trading. The better way, in my opinion, to use moving averages is again, using multiple timeframe analysis and HTF stands for higher timeframe, just in case you didn’t know that.
Higher timeframe moving averages. So for example, I would say, I want you to use the daily 20 MA, for example. Yeah, so on the daily chart, when price is above the 20 MA, we’re in an uptrend. When it’s below, we’re in a downtrend. Uptrend, consolidation, downtrend, yeah. So what you can set the EA to do is say on M15, what I want you to do is I want you to take trades when the daily 20 EMA is below us, yeah.
So I want you to take long trades when the 20 EMA is below us, and I want you to take short trades when the 20 EMA is above us. So all that we’ll do is assume that the trend is gonna continue. And what we’re doing is as price pushes back up towards the moving average on the daily, when we get a reversal alert in that direction, it will get you in short.
So we’re staying in line with the higher timeframe trend. Okay, so that’s what the higher timeframe moving average does. Same as the higher timeframe RSI filter. ADR filters, average daily range. So if you set this to true, it will automatically draw the ADR lines on your chart for you, like so. So average daily range. If you’re not familiar with average daily range, Again, there’s videos on YouTube and on the website about ADR. I use ADR as a Bible, basically. I’ve done a lot of research into average daily range with 15 or more, with more than 15 years worth of data to analyze market movement within average daily ranges.
And basically what you’re seeing on here is the ADR reversal indicator, which is available on MT4, MQL5 as well, on MT4 and MT5. And there’s a dashboard that goes with it. And basically what this does is it shows you what the extremes, the normal extremes of any particular instrument are. So with price movement, it will stay within its average daily range for around about 60%.
It’s 58% of the time it will stay within its daily range. So when the market is moving, as you can see here, it will stay within its average daily range as it’s doing at the moment, around 58% of the time. 42% of the time, it will exceed its 100% ADR. And its average daily range in this case for the last 10 days has been 81 pips. So it’s moved on average 81 pips in either direction on a daily basis. The theory behind ADR is when price gets extended beyond its average daily range, the market will be pushing hard in one direction and need to perform a profit take or a retracement or whatever you wanna call it.
So when we get extended beyond ADR, you’ll quite often find we will get a move back in the opposite direction. So the ADR basically in here, the filter, is set to, if set to true, you can select the ADR level you would like to start trading at. And what this does, it means that price will have to have touched this level before a reversal alert happens, before the EA will take a trade. So a lot of people use this just on its own, the ADR, so if price pushes down all the way down here and then pushes up and you get a reversal alert, that is where I want you to take my trade.
And they will set a short target of maybe a quarter to a half of an ADR and just trade back in the opposite direction. You can adjust the ADR number and we have an ADR hit bars back number in there, which is set to 20. So what this does is it measures back, in this case, 20 bars, which is default, which is, let me just do it exactly for you. So from where we are here, we go back 20 bars, which is there.
So that bar there. So it will make sure that a bar, a candle, within the last 20 has touched the line that you have selected. So the 150% in the way that we’ve got it set up at the moment, yeah? So all that is, if you just leave that default, you don’t really need to touch it. But some people asked for some fine tuning on this, which is why we’ve got this back in here.
But basically, if you’re trading M5 or M15, you shouldn’t be doing ADR reversals any time frame higher than that, really. It will always have hit within 20 bars, so you don’t really need to worry about it. You can adjust the colors, the styles of the lines, et cetera, but that’s basically what the ADR filter does. All right. Note, if you are upgrading from version 3.5 to version 4, the old version 4 had the ignore ADR filter after the first trade built in. So if you’ve been using the ADR filters for position trading, there’s a slight adjustment you need to make in the EA. So as of now, we’ve got ignore filters, which I’ll cover in a minute, and they used to be built into ADR. So all you need to do now is you need to set the ignore ADR filter to true, and that will trade exactly as version 3.5 did.
But I’ll cover all those in a minute and what they do. So that’s the ADR filter. Dashboard info. So the dashboard is now much more intuitive or complex, if you like, in the data that it shows. Previously, it just showed you totals. But now we’ve got an awful lot more information that we can see, which helps with back testing. So I’ll set all these to true. And again, this is all detailed in the manual, but you’ve got display dashboard is either set to hide or display, which will either hide that or display that, obviously.
You can adjust the sizing and coloring and all sorts of things if you want to. And you can now individually turn on and off particular pieces of information. So if I turn it all on, you’ll see everything that we’ve got there. Let me just set the chart to the background. So obvious things, it shows you your current drawdown on your account and if you’re in profit on the account. So this will either be showing you drawdown or profit from your entire P&L. So this is this, basically, this number here.
You’ve got your total profits in pips and money, your long profit only, your short profit only, again in pips and money, how much it’s made today, yesterday, this month, the previous month, the total profit the EA has generated on this particular pair. This will reset all based on magic numbers. So if you change the magic number on the EA for any reason, all of this data will be different because it’s drawn from your account history.
And obviously your account history is here, so if you set this to only show the last week’s account history, it can’t show you anything more than you’ve got in your account history settings in MT4. It also shows you the higher time frame RSI and the RSI of the chart that you’re on, your daily or your higher time frame moving average and the moving average of the chart that you’re on, the average daily range. If you are using the higher timeframe filter from the market reversal indicator, it will show you the direction, it will be taking trades in there. Long and short orders shows you what you have set here.
So both signals, if I set that to long, you will see that it will only take long orders. If I use the higher timeframe filter in market reversal alerts, I haven’t got enough data in there, so don’t worry about that. I was just doing my MP4. Let me show you that information. Next long trade lot size and the next short trade lot size. This calculation is obviously based on the settings that you have. If you’re position trading, this will tell you the next trade that is going to be taken.
So if you’re getting into multiple positions using a lot multiplier, so for example, let’s say you went short here and you went short here and you went short here and you were losing using a lot multiplier where you got them with one lot, two lots and three lots, this will say whatever your next lot will be. So if we go up here, we’ll probably get in with four lots or something, for example. So that’s basically what the lots show you. So if you’re just using it with a stop loss and a take profit, it will show you what it’s going to enter with.
Helps with mistakes. Some people have put the EA on the chart and it’s suddenly taken a massive trade. They’ve gone, why did it take that? Because they had a setting wrong. Now, as soon as you put it on the chart, you can see what it’s going to be trading next. Yeah. This is also fed from the magic number. Okay, so we have a thing called global variables.
If you want to see them, they’re under tools, global variables. This will store the lot size and the last entry taken by the EA for you. Okay, so they’re always available up there, but this is basically where that data is fed from. If you change the magic number, you shut down, you clear those global variables for any reason, that will obviously change. So you don’t need to mess about with it, but just a caveat, so you know what’s happening. Distance between trades, that is calculated, which we’ll have a look at in a minute. If you’re using position trading, which we’ll come on to in a second, those settings. That shows you how far apart your trades are going to be.
So this at the moment is set up to be distancing pips at 20. If I set that to 40, you’ll see that that will now change to 40. So it will take multiple trades in one direction and it will space them out at minimum of 40 pips apart. Your comment, again, reverse initial, sorry, reversal alerts EA is your comment. It shows you that now on the chart. I find this particularly useful because I have a VPS running with multiple MT4 accounts and all running different strategies.
So it’s easy for me at a glance to see, right, on this chart, I’m running ADR reversals. On this chart, I’m running M5 hedge strategy. So it tells you basically what it’s running and you just set whatever strategy you’re running as your comment. And obviously that will basically show you there what it is, okay? And we also have the magic number. So again, what a lot of people do is they open up multiple charts and say, I wanna trade multiple things.
And what they can never remember is what was the last magic number that I used. Okay, so what it will tell you now is the last magic numbers used. So on this chart, I know when I’ve got 1990 and 1991. So I know when I put the EA on this chart, I start at 1992, 1993, then go to this one, 1994, 1995, and so on. All right, so it just shows you much more information. Just this is just quality of life stuff that I and other people have found annoying, which has just been added in. Okay, so that’s your dashboard. We’ve got two dashboard done. Trailing stop and break even. So this is basically disabled as default. You can set to either use a break even or to use a trailing stop. So if you want to use a break-even, it will automatically move your entry, your stop, to break-even after X number of pips in profit, which is this move to break-even when in profit by X pips. So an example here is 10. So if we take a trade and it moves 10 pips in our direction, it will drag our stop up to break-even and leave it there. That’s all it does. It just protects your trade. So what a lot of people like to do is they like to use a break even, they enter into a position, if the position goes their way by a certain number of pips, they just protect their capital.
If that trade comes back down, you lose nothing. Okay, if it then continues to target, excellent, but it’s just a capital protection mechanism. Personally, I don’t like them, because when you put a stop in the market, the market comes and takes it. More on that in the course. But we also have the trailing stop. Trailing stop in pips, okay? So this setting here will automatically trail your stop by 40 pips. So the important thing to understand here is when you enter a trade there and it puts your stop, say 40 pips, when it tips up one pip, it will move the stop one pip.
So as price pushes, your stop will move with price. If you don’t want that to happen, and what you want to do is you want to start trailing when prices move to a certain amount in your direction, you would set that to be 40, for example. So in this case, what would happen is you would take a trade, set your stop to 40 pips. When prices moved 40 pips in that direction, it will then move the stop to here and start trailing behind price by 40 pips, okay?
So this is a better way to use the trailing stop. A lot of people, if they’re gonna use a trailing stop, what they tend to do is they will set their trailing stop in pips to less than their start trailing stop at X pips. So what will happen is you’ll have an entry and a stop 40 pips away. When price has moved 40 pips in that direction, it will move that stop and lock in 20 pips. Yeah, so that’s what that will do. So it basically locks in some profit.
Again, trailing stops are there to be hit by the market. If you put a trailing stop in, you can guarantee price will pull back and take out your trailing stop and then it will continue in your direction. So again, I’m not a fan of trading stops. I use them occasionally and I’ve just used some now. Yeah, so I’ve had trading stops on these positions, but they were very, very, very close to my TP. So the reason I use a trading stop is not because price has gone my way.
I use it just in case it doesn’t get to my TP because there’s nothing worse than price getting close to your TP and then plummeting back to your entry. All right, so that’s the only reason I use training stops, but they’re there to be used. And obviously you can back test with these and see what effect they have. They’re quite helpful actually in scalping strategies. So they’re good to have. They’re there if you want them. Basket trading settings.
So this is a bit more of a complex area. This is where I spend 90% of my time. So as you probably know, if you know me, I basket trade, position trade. So what I do is I take small entries in the market and take multiple positions. So basket trading is where you will enter a number of trades. Maximum number you enter, you can do what you like. I put 15 in because I never hit 15 entries before I get out with a profit.
Saying that occasionally it might happen, very, very rare. But yeah, so basically I just said that’s 15 or 20 or whatever you want, but just a high number if you want to continuously position trade. If you wanna get into a basket of trades and you don’t wanna get into more than five positions, obviously set it to five. So basically what basket trading is, for those of you that do not know, is where you take multiple positions.
So for example, as price pushed down here and got to this extension of RSI, for example, you could say, I want to take longs when this condition is met. So it would take a trade here for you. And then as the price pushes down, you would take another trade. As price pushes down, you take another trade. And what you do is you wait for the pullback in the market and then you exit all of those positions with a profit.
Okay, so that’s position trading. So it’s just basically taking a position in the market, position in this case is long, and you scale in and you do what’s called averaging in, which brings the average price down, which is a strategy used by an awful lot of large traders, stocks, I don’t know if you’re familiar with billions on telly, Bobby Axelrod, yeah, do you think he gets in with a stock with a million pound position?
No, he gets in and he buys and buys and buys and buys until he’s got to a point where the market moves in this direction and he profits. Obviously that’s a fictional TV program, but that is how hedge funds and other stock funds work as well. So that is basically what position trading or basket trading is, multiple positions. So this is what the EA is designed to do because it’s the tool that I developed for myself.
And this is the way that I basically trade. So I’ve got a course coming out on this, obviously. It’s going to be free. Hopefully next week I’m going to deliver that. So if you want to do that, you can come into that. So that’s basically where you set the number of trades that you want to take. We’ll have a look at this in the EA in a minute, and I’ll show you some stuff in the strategy test with it working this way. Multi-direction baskets. So when you take a position or a basket as they’re called, you’re entering in one direction.
You have to take an entry there, an entry there, an entry there, for example, this is a basket. If price was to push down, you could take entries long as well. So what typically you would do is you would enter in short and then get out when the market moves down, enter long and get out when the market moves up obviously. Enter your long positions when the market’s moving down. So multi-direction baskets basically take into account all of the positions that you have open.
Okay, this is set to default as false because I believe this is probably the best way to have it. But some people like to do multi-direction basket trading where what you’re doing is you’re entering constantly as the market is moving and you’re waiting for the EA or your trades or however you do it, you’re waiting for enough orders to be built up so that when it moves in one direction, there’s a profit to take. Okay. And that is what that setting is for multi-direction baskets. So if you set that to true, this total profit figure is what the EA will use. Okay. So let’s say for example you set I want to close all of my trades when I get to £10 in profit. Yeah, what it will do if you’ve got multi-direction baskets set is the total profit of all of your short positions or long positions have to hit 10 pounds before it will close the positions.
Okay, so this is how I personally trade. But that is what that setting does. Okay, so it takes into account all positions for profit take and loss take as well, which we’ll go into those settings in a minute. Or if you set it to force, it will count the shorts and the longs as separate baskets, separate positions, which is kind of how I think you should look at it. Lot size multiplier. Be careful with this. It’s set to one of default, which means that at the moment we are going to get in with 0.08 with our positions. When you’re taking a basket, for example, let’s say we’re going in long here, we would take a 0.8 long. Then we get in here with a 0.08 long. We get in here with a 0.08 long, right?
If you want to, you can use a lot multiplier. So if you set this to two, which is basically Martingale, and if you know about Martingale, you shouldn’t be doing it. If you know about Martingale, you’ve done it and you know that you’ve blown your account, you shouldn’t be doing it. But the lot size multiplier does have a use, which I’ll cover in a minute. If you set that to two, basically what will happen is this first entry you take here will be 0.08.
OK, the second entry here will be 0.16, 2 times 0.08. And then the next entry will be 2 times 0.16. So the next entry will be 0.32. Yeah? So we go in with 0.08, 0.16, 0.32, yeah? If you go five positions against G, for example, you can see what’s gonna happen, right? 1.28. Yeah, so you are now in what? Over two lots long.
Way too big. This is why martingale doesn’t work. It blows accounts very, very, very quickly. So the lot size multiplier, that is basically what it does. Use with caution. I would never recommend going over 1.5 as a maximum. Personally, I think 1.3 is the sweet spot to use this with because it scales you in gradually and it means that your drawdown doesn’t get ridiculous. But that’s what the lot size multiplier does. And what you will see is this figure here will change after every trade is taken and tell you what your next position is going to be. So that’s basically what the lot size multiplier does and it’s only used obviously with basket trading. Distance between orders calculation. This is new in version four. We only used to have PIPs before. Now you can select from PIPs or ADR. So distance in ADR percentage, what that basically means is you can say to the EA when you’re position trading, basket trading, I want to take a long there, okay, I want to make sure that my next entry is no more, no less than 40 pips, or sorry, no more than 40 pips. So basically the distance between the two has got to be 40 pips, what I’m trying to say. So what it means is it will stop the EA in consolidations, yeah, taking a long trade for you.
And then it moves down, get another alert and it takes another long trade. It moves up, doesn’t hit your target, another alert, takes another long trade. So it stops this happening. So what this is, is a filter to say, there’s gotta be a minimum of 40 pips between these orders for you to take another trade for me. Okay, so it’s designed to spread your entries out when you’re basket trading or position trading.
It’s designed to spread them out so that you get in as evenly as you can as price moves against you. In the past, we only had the option to use 40 pips. Now we can use ADR. And this is why, this is what I use and why I use it. So the distance between orders as ADR is brilliant to use as a quarter or a half, okay? So 0.25 or 0.5 of an ADR. Why? Because we know that the market moves in an average daily range, don’t we? The market moves typically 58% of the time within 80 pips. So if the market is going to push hard against me, one ADR, I don’t want to be getting in there, there, there, there, there, there, there, there, do I?
Because we’ll be in loads and loads of drawdown on that move. But if I got in half an ADR apart with my entries, we know that when the maxed pullback happens, which tends to be quite often 50%, we’re gonna be able to get out of all of our positions spread nicely apart. Yeah, so using ADR has its advantages because mainly it’s dynamic. So the average daily range of a pair will change.
This figure here, 81 at the moment, will change based on news, time of year, economic factors, bank decides to change rates, the ADR of a particular pair might go absolutely crazy because the bank rate has changed. Therefore, more money piles into it. So the average movement of that currency will change on a regular basis. And you’ll see this over and over again. The pound New Zealand I used to trade used to be very, very big. So Pound New Zealand at the moment is 112. I’ve traded Pound New Zealand a couple of years ago and it’s sitting at 340 ADR. Yeah, this changes. Okay. So what we’re interested in is what’s happened in the last 10 days. Where are we now? We need to spread our positions out based on what the market movement has been recently, not what the market movement could be in the future, or a particular number of pips. So it’s a dynamic measurement, so it’s much better to use. So we’ve got that as a new setting, so ADR percentage, which as I say, I would recommend play around with it. One ADR, half an ADR, quarter of an ADR.
Obviously, the closer your positions are together, if the market pushes hard against you, the more drawdown you’ll go into if you’re position trading or basket trading. These entries here, these settings here are close or win X pips in profit, pretty standard stuff. So this applies not to baskets specifically, it does apply to baskets, but it also applies to all trades taken by the EA. So if you’re using stocks and take profits, these will also be usable by you.
So these are global options that you can use. So close all when X pips in profit, it’s pretty self-explanatory. When over here, your longs or your shorts or whatever says I am 20 pips in profit, if you’ve got that set to 20, it will close the trade for you. Closing a loss when at X pips. Again, if your loss shows minus 20 pips, it will close that position out for you if you’ve got minus 20.
Close all when X money in profit. So that says I profit, should be saying in profit. Close when X money in profit, basically you can set that to a monetary value, say 20 pounds, and what it will do is it will close your positions out when you’ve got 20 in your P&L. So for example, in your long profit money, if that was 20 pounds, it would close your positions out. Same with closing loss.
So you could set in there that you want to close it when it’s in a loss. Closing profit at percentage of ADR. Okay, so when I’ve reached half an ADR, when market has moved half of its normal average daily range I want you to take me out of the market. Closing loss at ADR, same thing. So if the market moves half an ADR against me, get me out. So that’s basically the options you’ve got. And if you set all these to zero as they are as default, obviously none of them will be used, but you can use a conjunction of them as well.
So you can say, I want you to close my positions. If I’ve got four or five positions on, I either want you to close them when we hit one ADR or when we hit 20 pounds in profit. Whichever of those comes first, it will close them out for you. This is particularly useful when you’re getting into multiple positions. And you may find if you’re using a lot multiplier, you’re gradually increasing the size of these positions.
You might find that just pushing to there will make 20 pounds in profit, but it will only be a quarter of an ADR of a move. So having both of these set up will mean that it will get you out with money in the bank if we’ve got multiple positions on, rather than waiting for the whole move to move ADR, which would take to probably about here. So this will get you out quicker. That will get you out, obviously, with more money.
But it depends whether you want to be greedy or you want to be profitable. Yeah, so there’s options. So that’s what those settings do. Screenshots and alerts. So basically generating alert to entry, these are all pretty self-explanatory. All set to false is default. If you want to take screenshots, it will do that for you. It will store them in your file section in your empty four folder.
So you can take a screenshot and basically every time it takes an entry or an exit it will take a screenshot and save it. So it’s good for journaling, which you should be doing. So journaling is great. And obviously taking screenshots adds to your journaling. Generating alerts, entries and exits, obviously entries and exits is fairly straightforward. When it gets into a trade, it pops up and goes, I’ve got into a trade.
When it gets out of a trade, it pops up and goes, I’ve got out of a trade. So just an alert system. You have to have one of these turned on. So you either choose pop-up, pop-up, email, or push. And obviously you select what you want. So I personally like to have my generate alert at exit set, which prompts me to go and have a look at the VPS that’s running on one of my monitors and have a look at what I’ve just made, basically.
So it’s just an alert to say, hey, look at me, I’ve made money, which is great. It’s a nice motivator. So that’s basically what the alerts do. Block size settings, this is to do with the size of the reversal alert. This is a feature that somebody asked for. It’s not something that I personally use, although I can see the use of it. So use set block size, basically.
What that means is there will be a minimum and a maximum size for this block, basically. So this rectangle here is your reversal alert. What this is saying is if you set this to true, only get me into trades if the alert is between five to 20 candles. Okay, so this is one, two, three, four, five, six, seven, eight, nine, 10. So that is 10. Yeah, occasionally what you will find is you will get a rectangle drawn like this.
Because what will happen is price will push down and it will just sit there consolidating for absolutely ages. Especially on higher timeframes, you tend to get very large rectangles. And obviously the rectangles are what, when price crosses above it triggers our alerts. So the idea behind this is to say, if I’ve got an absolutely massive reversal alert, it’s a consolidation.
It’s not a sign of strength in the other direction. It’s just a sign of that maybe that consolidation is building and getting slightly bigger. Yeah, so that’s what that setting is for. Again, it’s not something I use, but if you want to use it, it’s there as an option for you. Partial profits and drawdown control. Anybody that’s done my course will know about drawdown control, but I’ll explain in a nutshell what it is here.
Your drawdown control type is disabled as standard. What drawdown control is, is where we close parts of our position out when a particular monetary value is hit, okay? So for example, if you set this to per trade and set your drawdown amount to be something like, let’s go with 50. Yeah, so if we’re saying if we take a trade and it gets to 50 pounds negative, i.e. gets to 50 pounds in a quarter of my position, yeah? So I take a trade here, it pushes up, mucks about for a bit, and then it pushes down, and it gets down to here.
My stop is down here. When it gets down to 50 pounds in drawdown, what I’m gonna do is I’m gonna shut a quarter of that position out, yeah? So let’s say this is a 0.04, for example, just to make it simple. What will happen is when we get down to 50 pounds in drawdown, it will then close 0.1 of that and turn it into a 0.3. So I will take a 0.01 loss.
So it’s a partial loss on that particular trade, okay? So it helps you to manage your drawdown across multiple pairs. Particularly useful for position trading and basket trading, where you’re taking multiple positions because you can say, if we’ve pushed against this by X amount, I want you to start scaling out of these positions at the top.
So let’s say we got in, let me just remove that. Let’s say we got in here, here, here, and here. When we get down to here, I want you to start closing a bit of that. If it pushes further, close another bit of that. And if it pushes further, close another bit of that and possibly close a bit of that. So rather than taking a loss, you start to gradually scale out the position because all we’re waiting for obviously is that and then we will make a profit on everything.
But we might want to reduce our drawdown on the way, it’s called drawdown control. So that’s what these settings will do. You can do it per trade or you can do it per basket. So per basket, obviously what that will do is if you take them one, two, three, four, it will, when the entire total of these orders gets to minus 50, it will close out partials on all of them, a quarter of each of the positions, rather than an individual trade. So there’s different options you can use. Different people do this in different ways. So the options are there for both for you. You can use pips instead of money.
So draw down amount, set that to zero and then set this to minus 200. Now, when you get to 200 pips in draw down, it will start to activate the draw down control for you. A percentage of ADR, same thing. When we get half an ADR against me, close out quarter of my position or half my position or whatever you want to, yeah. Partial profits, again, people take partial profits. I don’t believe in taking partials because what it does, if you are taking partials, you are ruining your risk reward ratio.
Again, something I will cover in a course, but if you take a partial profit, obviously, let’s say, for example, you take a trade here and you put your stop there and your TP there. If it moves up to here and you take a partial profit and then it pulls back down to break even, what have you done? You’ve just reduced your trade to a one-to-one instead of one-to-two. One-to-one is never gonna make profit.
So I don’t particularly agree with it, but it’s an option that people wanted, so it’s there. So take partial profit. Partial profit to close will be a quarter of the position or a half of my position. Say, look, I wanna shut half my position when we get to 100 pips. Yeah, you can only do this on pips. So that’s what that option is if you want it. So you can do partials.
Okay, V4 features. So moving on to these now. Close order in opposite alert. I’ve covered this one already. So what this does is it closes when we get an opposite alert. So if we’ve gone short here, for example, as soon as price pushes up and gives us an alert here, it will close out that position. Basically that’s what that does.
Regardless of what your filters are, it’s just saying next alert, get me out. D in it when closed trades. This is, D in it is just a fancy word for close, shut, undo. So basically what will happen is when you have this set to true, it will take the trades for you based on your criteria. When those trades are completed, i.e. you’ve gone flat, so it’s either hit your TPs or your stop losses and you’ve got no trades in either direction, the EA will uninstall itself from your chart.
So this is very useful for, and one of the reasons it is here is because a lot of the Live Room members will add the EA to the chart when certain conditions are met and they just basically want the EA to get them in into their positions. But what they don’t want to do is if their positions play out overnight, so let’s say for example, we got in short here, here, here and here, we’ve got down to here and we’ve got a nice profit. I want the EA to close all my positions, but what will happen is if it pushes up again and gives us another alert, it will take another short.
Now I’ve closed this trade, I’ve finished this trade, I might not want to take that short. So what this setting does is it will basically deactivate the EA from the chart. So it will stop you trading. And this is really useful if your trades close overnight. So obviously we all have to sleep. I sleep during the Asian session. If the EA gets me out of a load of trades during the Asian session, because there’s a big yen move or New Zealand move or something, and it’s finished that particular position for me, I don’t want it to get me into another position.
You know, go, I’m asleep, I can’t do anything about it. I haven’t got an alert popping up to tell me I’ve got out of that position. So that’s what that’s for. It will just basically take one trade and then it will close it, okay? So it’s something everybody’s been asking for and it’s really useful, because I quite often will just add the EA onto a chart and take a trade using the EA and then take it off and manually monitor it. So that’s what that’s for. Trade only outside daily highs and lows and trade only if pierced daily highs and lows. These are new features, again requested. This is to do with liquidity runs. Let’s flip back to my chart. So you’ll see on my chart, it’s quite messy.
And let me just take some of these off, these lines. So you can see I’ve got yesterday’s highs and yesterday’s lows on my chart as indicators. So there’s the high, so this blue dotted line here, yeah, that is the yesterday’s high line and yesterday’s low is there and the yesterday’s low line over there, you can’t really see it there, but the blue lines, the blue dotted lines, yeah, yesterday’s high and yesterday’s low.
You see it down there, right? So what happens with these two new settings is as price pushes up above yesterday’s high, here’s a prime example here. So we’ve got a reversal alert above yesterday’s high. That is that filter. So the EA will only take trades if they happen above yesterday’s high. The close of a candle that triggers the alert has to be above that high, okay?
The other option we have is piercing. So for example, let’s say we got an alert on this candle here. So this was our reversal alert here. It obviously isn’t, but I’m just giving an example. Because price has pierced yesterday’s low, but the alert happened within yesterday’s high and low, that is what a pierced high-low alert is, okay? So let me just switch back to the EA. So this one here, trade only outside daily highs and lows.
So the candle has to have closed outside of the highs and lows for the trade to actually happen. Pierced means it can adjust pierced yesterday’s high and low, all right? And these are really useful because a lot of people trade liquidity runs. We all know that the market moves up and down and it takes out people’s stocks basically, yeah? So here we’ve got a good example, price pushed down, made a low.
There’s the low, price pushed down, took out that low and then closed back inside. Yeah, so that’s basically what that setting is doing. So here we’ve got yesterday’s low, well, the low of this particular day was there, price pushed down, took it out and then traded back up inside it. Yeah, here is yesterday’s low, price pushed down, pierced it, traded back inside it, came down again and then traded back up inside it. Here’s that low, price came down, took it out, traded back up inside it. Yeah. So that’s what that’s doing. It’s basically stop humps, basically. Liquidity runs, basically.
They’re just taking your liquidity out and then moving back in the opposite direction. So those two filters now allow you to only take that type of trade. A lot of people love taking that type of trade. So those are the filters that we have for that one there. New settings, spread filter, we’ve covered this one. If you set the spread filter to true, it will not take trades if they are above 10 pips. Okay, so you can set that to whatever you like, but it basically stops you getting positions when the spread is too far away.
Use fake stop loss to calculate lot sizing. We’ve covered this one already as well. So this is used for position sizing. So what it would do is if you set this to true, literally all it does is it deletes your stop immediately after it’s placed. So you can use this with a stop loss strategy. You can also use it with a position trading strategy if you get into multiple trades. So you can now use that to calculate lot size correctly for those trades. Ignoring RSI and high time frame filter. So basically all these ignore filters are new. So these are a major change. So what happened in the past is, if let’s just reset the EA and say, I want to take a short trade and particularly for position traders, this is gonna be very, very useful.
So I want to take trades when the higher timeframe RSI on the four hour is extended above 68 and below 32. Yeah. What would happen is on the four hour, you will see sometimes price will push down and get extended beyond whatever the level is, okay. And then it will push up, but it won’t hit your target. So let’s say for example our target was up there and what it will then do is it will push back down against you to here for example but it won’t get extended to the level that your filter is set up. So what the EAU can now do is after it’s taken the first trade based on the conditions that you set is if price pushes down and gives you a new alert, it will ignore the filter that you’ve asked it to use.
So we’re basically saying, use filters only for my first trade. For the rest of the trades, just take every entry you can possibly get. Obviously, however many pips apart, you’ve set with ADR or pips, okay? So this is what the ignore filters are doing. So all of these basically you can now filter out every single condition. So I personally use higher time frame RSI so I would set that to true. If I was using moving average on the higher time frame as well which I often do I would set that one to true as well.
Okay same for the ADR. A lot of ADR traders will when we get a strong push like this on ADR, they will take an entry, go short, sometimes it will consolidate for a day and it will push up again and have another sort of half an ADR push. And then it will give another reversal alert. Now, if that hasn’t hit ADR on that day, obviously that ADR filter will stop the EA trading. Setting this to true means that it will just continue to take trades for you, regardless of whether it’s hit ADR or not, and get you into that position and exit it when the market pulls back in your favor.
So these are really useful. If you are a position trader and you trade with me in the live room, this is basically what we’ve been waiting for. So we can now set the EA onto pretty much any chart we like using the entry strategies that we use in the live room and set these to true. So what we will say is when H4 RSI is extended above X, get me in. And the EA can just get you in and then go, oh, well, if it’s pushed against me, I’ll just continue to trade, which we couldn’t do in the past. So this has taken the full automation of the EA to kind of the next level.
And the next version coming out is going to be able to allow us to do manual drawdown control as well. I won’t cover that now because it’s a little bit more complex. I’m going to release that after I’ve released the new version of the course, which is going to teach everybody how to position trade. But that covers all of those. So that is all the settings. Anybody got any questions on to some examples of strategy. I’ll just type into the live room members because I’m running a bit late on the live room. Okay, yeah, far away questions. Can I back test the AI offline?
You can only back test the AI offline. Yeah. So the back to the strategy tester works on data. I personally have ticked data suite. So I have years and years and years of data on multiple instruments. But if you’re just using normal MT4, it uses MT4 data, historical data. So you backtest using whatever you want, but you can only backtest using the data you’ve got available.
So let’s say, let me just load a set file and I’ll show you. Okay, so if I start this now with a visual back test, see I’ve got the 8th of September, 2020. So I’ll start that testing. And you can see we’ve started on the 13th of April. Yeah, 13th of April, 2021. Because my broker data on this MT4 only goes back to April, 2021. Yeah. So if I go to tick data, you’ll see we will start at that particular date. Because my tick data goes back a decade or so. Yeah. So look, we’re starting 8th of September, 2020. So the strategy tester is only working on whatever data you’ve got. You see the work on your broker data or it’s working on TIC data if you download TIC data suite.
What version of MT4 do I run? No idea. Whatever the latest one is. Build 1340, latest one. As far as I know, 1340. How do you arrive at 10 for the default value for the spread filter? That’s just a number. Points and pips because different brokers and different instruments are measured in different ways.
So that is the number. Again, basically, any setting that you’re not sure on, stick it in your strategy sester and test it. So it’s basically, it’s marked down as points because those are typically, points are basically what MT4 uses. But 90% of the time with most most instruments, they correlate to pips as well. So it’s just defaulted to 10 pips. Every single default you see in here is irrelevant. Default is there just because it’s got to be something. It’s not defaulted to something because it’s the right thing. It’s defaulted to something because we’ve got to default to something.
So when we reset this, it’s defaulted to 2040 for a fixed TP and stop loss. That’s not a good… I don’t know if that’s good or bad. I’ve no idea. That might be good for Aussie New Zealand, but it might be terrible for pound New Zealand. No idea. It doesn’t matter, does it? It’s just a default. It’s just whatever it’s set up, because we’ve got to use something. If we don’t use something, it won’t work. Yeah. So that’s all it is. But spread, I would probably go five. It depends on your broker. If you’ve got a really bad broker with really bad spreads, you might be trading three to five pips on a normal daily basis. My broker is between half to one and a half on most instruments.
So five pips to me is a wide spread. When I see news events, a five pip spread is not unusual. So we’re spreading at the moment on New Zealand, US to about two pips. Pan-New Zealand will be bigger. That’s four pips. Yeah, so you see I’ve got 46. So you see that where it says 46, it’s four pips basically. But try it in the strategy tester. In the strategy tester when you’re testing, yeah, you got the spread.
So if I set this to 30, and set this to true, it won’t take any trades. Yeah, if I set it to five, it will, for two, for example. Okay, any more questions on settings that I’ve covered? No? Cool. Okay. So I’ll quickly run over strategy tester. Yeah. So what I wanted to do is help people to back test with the EA or any EA, no, not this EA, just back testing in general and strategy development basically. So the idea of this EA, as you know, as I’ve said before many times in the Telegram group, is to automate the way that I trade, but to semi automate it. Yeah. So be able to allow me to get into the market based on conditions that I like to see happening without me having to sit there, wait for an alert, analyze a chart, and then take a trade.
It’s not really designed to be a set and forget EA. It can be if you want it to be. But if you’re going to do that, you are going to need to back test accurately. To back test accurately, you need tech data. Because if you don’t use tech data, you’re not going to have enough information in your MT4 from your broker to be able to go back far enough. And you’re not going to be able to get down to necessarily the TIC, the most accurate data to make sure that that really, really works. So the way that I tend to test strategies is I use control points. With EA, you can only use TIC or control points. Open prices will not work. It’s the fastest method, but it’s only for EAs that use control bar opening, which this doesn’t basically.
So control points is basically where I start. And what I tend to do is I tend to go for the last six months. So I would go for something like 1st of March to the 8th of September. And what I will do is I will set the year up to trade a strategy that I think will work. So let’s pick, for example, this GU M5 hedging strategy. So what this is gonna do is it’s gonna trade in both directions for me automatically.
I’m gonna be using 0.2% of my account, and I’m gonna base my stock on half of an ADR. Yeah. And I’m gonna get into the market when the RSI is extended above the 60 level or below the 40 level. Yeah. So those are my only filters. That’s all I wanna do. So basically, when RSI gets high, I want to start taking shorts.
When it gets low, I want to start taking longs. I’m going to do this on the M5 timeframe. I want you to get into as many positions as you need to. And I want you to multiply each of those lots by 1.3. I want you to make sure my trades are no closer than half an ADR apart. And I want you to get out my positions for me when I either make 15 pound of profit or I’ve made half an ADR of profit. Yeah. And the only other settings I’m gonna use are the spread filter because I don’t wanna get caught out on those overnight candles.
I want you to use a fake stop loss because I want to use a percentage of my account for my initial entry. And I want you to ignore the RSI after it takes the first trade. So if price pushes up above 60, I want you to get me in short. If the RSI hovers around that level, but you push over half an ADR that way without taking RSI high, I still want you to get me into shorts, regardless of what they say, because I’m already short. That’s my position. So that’s basically a simple setup. So what I tend to do is I use visual mode to start off with on the highest setting using tip data or not.
It’s entirely up to you. And I basically start the back test. And I visually look at what is going on on the chart. So I want to see that this is doing what I’m asking it to do. So I’ve asked it to take a long when RSI is below that level and take a profit when we get up to there. So that was probably half an ADR. So the ADR on this is 111.
So it took profit 56. Oh, that would have been 15 pounds in profit probably. No, four, sorry. 55, oh, sorry, I’m targeting half an ADR, aren’t I? I forgot, yeah. So it’s half an ADR. So it’s taking profit of half an ADR. There we go. So it’s got into another cell there, short, because the RSI at the peak was above the 60 level.
So it’s gone short for me. Yep, so we’ll let it continue to trade, and it’s taken a long, because the RSI got below, we got a reverse alert in the opposite direction. So now I’m long and short, I’m hedging. So price pushes down, doesn’t get into a profit. There you go, so taking a profit there. So that’s half an ADR, 56 pips roughly. There you go, so I’ve got a long on. Now, hasn’t taken another position here.
That was a reversal alert. You see that it didn’t take another long. The reason being is because the distance between those trades was only 39 pips. I’ve asked it to get in, it’s gotta be at least half an ADR, 56 pips apart. So the reason it didn’t take that trade is it’s because it’s too close to this one. I don’t want to get in too close together in case it goes the wrong way.
Yeah. So we carry on trading. See what happens with price. And I’ll basically do this process for a period of, I don’t know, a few days, not in few days in real time, obviously, a few days of trading in the simulator. So it’s taking another buy position there. You see the lot size was 0.1. Now it’s taking a 0.2 because I asked it to multiply it by 1.3.
And it’s taking a short because we had another signal there. So I’m basically just eyeballing it to see if it’s doing what I want it to do. And it is. So it’s closed out my position here with that profit, yeah, which is half an ADR. So this is 63 pips, and this is a loss of four pips, so the total is 59.57, is something I haven’t measured it exactly, but it’s around 57 pips.
It’s closed both those positions out, because I asked it to get me out when my entire position is half an ADR. Yeah, it’s taking another cell position up there, a 0.1 and a 0.2, because we’ve had another reversal alert, and these are more than 57 pips apart. Speed it up, and just wait for it to continue to do its thing. Yeah, so all I’m doing in this process, in this stage of testing in the back tester is I’m eyeballing this thing to see, right, is it doing what I’ve asked it to do?
Yes, I’ve asked it to take trades X distance apart. Every time you get into a reverse alert, as long as the RSI is above or below the levels that I’ve specified. So I know the EA is working. Okay, so that is stage one of backtesting. And you can do this for as many days as you want. So I don’t know how many days we’re into this now. So we took our first trade there, didn’t we? So one, two, three, so I’ve done three days.
Might wanna let this run five, 10, 15 days, just to make sure it’s doing what you want. Yeah, and then you can stop that. Okay, and then backtest six months worth of data. So you know it’s working as you want it to do. So then take visual mode off and start. Okay, and this will now do that exact process obviously without visual mode. And visual mode is obviously very slow because it’s got to draw the indicators, do all the calculations.
Non-visual mode is very quick. So you’ll see that results start to fly in pretty quick here. And all I do is I sit there and I monitor the graph and see if that graph is going where I want it to go. Are we getting into a huge drawdown? Has it blown the account up? Are we making a profit? So I just basically eyeball it to see if it’s a profitable strategy. And I’m running this only on six months. So if it can last six months, it’s got a lot of promise. So if you can get six months worth of trading history where it’s generated a decent return, and in this case, because it’s a position strategy, it hasn’t generated a hideous drawdown that you’re not comfortable with, then you will progress it further. So this is stage two of the backtesting, is it a good or a bad thing to be pursuing? Now, if this suddenly goes boom and blows the account up, no good. If it’s a stop loss strategy and you see this going like that, and it keeps going down and down and down, by the time you’ve got to about four or five months, you think, yeah, this is probably not a good strategy. It’s four months in, it’s not really made a profit.
If on the other hand, you’re using a stop loss strategy and you’re seeing an equity curve that kind of looks like this, it’s going up, it’s like four or five months in, we’re profitable, brilliant, that’s worth pursuing. So that is stage two. Stage two is, is it got promise basically? Are we gonna make this work? I’m talking about my EA here, obviously, but you can do this with any EA.
It works with all EAs out there. Stick it in the strategy tester, change settings. Does it do what I’m wanting it to do? Yes, brilliant. Let’s look at it a bit closer. When you download demos, for example, from MQL5, this is what you should be doing. How can I make this profitable? Can I make it profitable? Okay, so I’m, what, 30-odd trades in.
I’ve made over 100 profit on tiny little lots. It’s got into two positions there, it’s got into three positions there, took four positions there before it made a profit, three there, got into four there. So yeah, it looks good, doesn’t it? Okay, so that’s it, that’s stage two done. Well, I’m happy with that. Yeah, 1% of drawdown, made a bit of money, it’s all working, positive profit curve. Stage three is to then run this over a longer period of time. Now, the longer period of time is entirely up to you and will be dependent on the timeframe. So this is an M5 strategy. If you can get an M5 strategy back tested over an entire year and it’s profitable, there’s a high probability that will be a profitable strategy moving forward. If you’ve got an H4 strategy and you test it over a year, you’ll probably find you’re not going to get many trades, are you? So here, for example, we took 33 trades in, let me start, 1st of March to the end of March. So we took 33, took basically a trade a day.
On an H4 strategy, if it’s taken like three or four trades in a period of six months. That’s not enough data to work on, is it? So with a higher timeframe strategy like H4 or daily or even hourly sometimes, you will probably need to backtest five to 10 years of data, okay? But it will happen a lot quicker because the candlesticks are gonna obviously be much bigger and they’re gonna draw faster, okay? So next stage is obviously to go back a year. So I then go back to 2020.
And as you can see, this is how I’ve got mine set up at the moment, 09, 08. So I’ve given it a quick eyeball over a period of like 30 odd trades and it looks profitable. So now what I do is I set this to run from that timeframe for an entire year on control points. And I basically leave this running. This might take an hour, hour and a half, half an hour, I don’t. Depends on your PC, your speed, all sorts of stuff.
But basically I will now let this run. So I’ll shut this down. Well, not shut it down, leave it running, but I won’t pay any attention to it. It will ping at me at some point when it’s complete. And then I will come in and go, right, is the graph up here or is the graph blown? Or is the graph down here? We’ve made a loss. So what’s the outcome for the last 12 months on control points?
And then I will look at the report. Have we got into way too much drawdown that I want this to be? Has it got a big enough profit? How many trades has it taken? So you’re doing a little analysis of the report, basically to say, right, is this worth pursuing after a year’s worth of data? Yes, brilliant. Okay, next stage, when I’ve got that done, is to move from control points to every tick.
This is where in your report, you get that 99.9% accuracy. So I’ve visually eyeballed it’s working to make sure it’s doing what I’ve asked it to do. I’ve done six months of data and I’ve given it a quick whiz through for maybe a few months to see that, yeah, it seems to be profitable. I’ve given it an entire year of control points now, and it’s still come back as a profitable strategy.
Now I’m going to make sure, because control points is very crude, it doesn’t work on every tick. Now I’m going to move to every tick, and I’m going to make sure that that last year is roughly correct based on the control points. And most of the time, you’ll find it will be very, very, very close. So then I start that. This will take ages. This will take a while. But this is why we start with an eyeball, a quick check, a year’s worth of control points. Because if we’ve done those three, which maybe will take us an hour, if that, we can then move on to every tick. If this report comes back as profitable, that’s it, we’ve got a profitable strategy. Next step is, after this has been completed, you’ll see this is taking trades, but it’s gonna take a lot longer.
Takes a lot longer to run and tick because it’s doing a lot more calculations. You may have to leave this overnight. Once this is completed, then the next test for me personally is it works brilliantly on Pound US. Will this work on Euro US? Same process, start again, visual mode. Let’s see if visually on the Euro-US dollar, it does the same thing.
And then we’ll go into non-visual. Has it got a nice profit curve for 20, 30, 40, 50 trades? Yeah, brilliant. Do a full year on control points and then do a full year on tick data, okay? So that’s the process that I go through for strategy creation, if you like. So we’re basically wanting to figure out, is it worth pursuing? And it only takes a minute to do that, doesn’t it?
You can see visually, it’s doing what I want it to do. And if you watch this, I’ve got it on tick data, actually, so it’s quite slow at the moment. But if you watch this on control points, you can see the market ebb and flow, and you can see what’s happening. And that also allows you to come in and go, right, it seems that it doesn’t quite get to half an ADR as often as I’d like. Let’s have a go and see if, for example, I set the target to a quarter of an ADR.
Let’s see what impact that would have. Would it get out of those positions quicker? So you saw it took a sell, yeah, here. Didn’t quite get out, did it? Took a buy, didn’t quite get out. So half an ADR is a bit far. So what happens with a quarter of an ADR? It’s probably gonna hit target now, is it? No, it didn’t quite. It’s about 20 pips it moved there.
But you get the point. Basically what we’re doing is we’re saying, right, those settings don’t quite work. I want more trades. If we want more trades, let’s set our targets lower. Yeah. So there’s all sorts of things we can do to sort of adjust basically. So that’s the process. Anybody got any questions or anybody got anything they want to talk about with strategy testing?
Because it’s something I get asked about a lot. And I get the feeling a lot of people don’t actually know how to do backtesting properly, as in that way. Because that’s basically the way that I have always done it, is a case of, is it working as expected? Yes. Brilliant. Then I’m going to pursue this further type thing, rather than sticking an ear on a chart and just letting it trade. Does that make sense to everybody as a logical way to develop strategy?
This is the first time I’ve been taught how to back test this way. Yeah, understood, good, cool. Yeah, and it’s a bit that people miss. And I see this from the downloads of the EA. There’s hundreds of people have downloaded the EA. Not obviously not hundreds of people have bought the EA. But what are these other hundreds of people done? Have they downloaded it, stuck it in here with the default settings, press start and gone, oh, that doesn’t make money and then dumped it.
If yes, then we need this education, don’t we? There’s no EA that is gonna work 100% out of the box. It’s not how it works. Something, and this is why you find all these EAs It’s not how it works. And this is why you find all these EAs on the marketplace, gold scalper, euro scalper, Aussie scalper, because they only work and have only been back tested on the Australian dollar, New Zealand dollar during the Asian session.
And they’ve got six months of data where it actually made a profit. They show you a chart. That doesn’t mean that’s gonna be a profitable EA. You need to make sure that data is solid. Go back three years. Does it work over three years? No, it don’t. This is why most of the EAs you find out there blow your account. Most of the EAs actually blow your account because they use stops, but I’m not going to go into that now. Anyway, so I’ve got some strategies which I can show you. I can’t really show you. I mean, you’ve just seen one there, the M5 hedging.
So M5 hedging is brilliant. I’ll stick it on EURUS, we can have a look at it. I haven’t tested it on EURUS. It should work on EURUS as well. But basically all this is doing is it’s taking trades and it’s using the market movement. So the market moves up and down and up and down as we know, and 58% of the time, what’s it do? That. 80% of the time, the market is in a range and that range could be that size, that size, any size you like, but 80% of the time the market is going up and down and up and down and up and down. So the hedging strategy takes advantage of this fact in that market moves down, we get out, but we get out within an ADR. We know it moves an average daily range. So why target anything bigger than an average daily range?
Target the average daily range or lower. If the market then goes against us, with a buy in the opposite direction, we’ll get in again. We need to make sure it’s a good distance away because if the market decides to push down for three days on the trot against us, we don’t want to be getting in 10 times in one day, do we? And as you can see, the EA there, got in there, market pushed down for a day, the next day, the market pushed up, why? Because everybody that hits the sell button has to do what to get out of their trades, hit the buy button. What does that cause the market to go up?
Quick lesson in market movement, every time you hit the sell button, what do you do next? You hit the buy button. What do you think everybody’s doing when the market moves down? They’re selling. What do you think they got to do next to get out of that market? Buy.
Why does the market move up and down? Yeah, simple. So basically that’s what this is taking advantage of, market movement. Every buyer becomes a seller, every seller becomes a buyer. All we’re doing is we’re riding the waves of the buyers and the sellers as they take profits on their positions. Yeah, not us obviously, institutional banks, hedge funds, the big players, the guys that move the market, market makers as a name.
But that’s basically all this area is doing, it’s profiting from those moves, okay? So you see there, we took a short, that didn’t work, so we took another short, that didn’t work, so we took a short. Everybody that was buying had to sell, we took advantage of that. Yeah, so that’s what hedging does. You’re always in the market, you’re always either long or short or both.
And it doesn’t matter which way the market moves. All we’re doing is we’re waiting for the market to correct itself and we’re profiting when the market correction occurs, yeah. So this particular set file is M5. I’ve tested this and I’m running this live. I’ve been running this live for a good month now. This particular set file is been back-tested on tick data for every year and it’s held up fine. Worst case scenario, you’re getting something like 10 to 15% drawdown on your account.
But again, we’re going into details about position trading and other things, but this is an EA that you can use. This is obviously, this has been developed and tested on pound US, and obviously you can see it working now on euro US. It will work on any pair because the reason it works is because we are using what? ADR, yeah? ADR changes for every instrument.
So if you use ADR as a measurement for taking profits and spacing positions, it will always work on all pairs because all pairs move in an average daily range. Yeah, so that’s one set file. I’ll make these available as well so you can muck about with them. They’ll be in the telegram group. Let’s have a look at mean reversion, M15 mean reversion. So this is set up to take trades in both directions using a quarter of a percent based on half an ADR, which is what I like to do. I like to let the market move half an ADR against me before I take additional positions when I’m position trading. We are, that’s just normal indicator stuff, higher time frame filter. 14 RSI has to be extended above the 68 to take short, below the 32 to take a long.
That is the only setting there. We’re taking basket trades. We are not using a lot size multiplier on this one. Distance in ADR percentage is half an ADR apart. Taking profits when I am 25 pound in profit or one ADR in profit. And we ignore the higher timeframe RSI after the first trade. Yeah, so that’s that one there. We’ll give that one a quick run.
So that’s in 15, let’s stick it on pounds US because that’s what that set file was done for. So you’ll see the dashboard, if I’ve got the dashboard on, I’m gonna dashboard on one sec, let me just put it on so we can see where the RSI is. Ba, ba, ba, ba, ba, RSI. Right, so see from the dash, we’re using the four hour RSI here. Right, so see from the dash, we’re using the four hour RSI here, which is currently 28.88, so that’s below 32.
So we’ve taken a long, we’ve pushed down, we’ve taken another long. RSI is now at 15, massively extended on the four hour. Big push. And obviously these positions are minimum of X apart, which is 66 in this case at the moment. You see this dynamically changing. This is why we use ADR. ADR changes on a daily basis. So you want to be using whatever, whatever the current range is.
So 74 now. So as price pushes hard and gets further average daily range, we want to make sure we space out further to make sure that we’re not getting too far too close together. I’ve got a feeling actually this set file might be wrong because I think I did this with a lot more supplier 1.3 but we’ll see what happens. So you can see basically it’s obviously just going into consolidation at the moment but it’s taken multiple trades regardless of what the RSI is now. Now, if price continues to push down, it will get into additional positions.
Obviously, this is an H4 strategy. So when you’re trading higher timeframes, like four hour, of course, your trades are not gonna play out in a day. They’re gonna play out over a period of days and weeks, as you can see with this one. So we’re one, two, three, four, five, six, seven, eight days into the trade. So it takes a long time on H4, obviously because the timeframes are longer. I can’t remember what this hell on this trade takes to be honest, so we might be sitting here for a while.
As the guys from the live room will confess, sometimes we’re sitting there with our pies in the oven for many, many days. But basically, obviously we’re doing a visual test here so you can see what it’s doing. It’s taking trades and it’s making sure that they’re spaced out. So we’ve got 90 pips there, 100 pips there, 130 pips, that one’s 76. So it’s just got And obviously, if you’d have had a lot multiplier running on this 1.3, which is why I’m thinking I might have saved the wrong set file here, the 1.3 lot multiplier would have gone in with a 0.3, a 0.4, and a 0.5. And that pullback would have got you out with the profit. So this might take a little bit longer than normal, but we’ll let it run.
Anybody got any questions while we’re watching this? Or does anybody not want to watch this and look at other set files as well, other strategies? I wanted to whiz through all these strategies fairly quick, but I wasn’t actually planning to do a full test on them. It’s probably quicker to do it on the graph and just show you the graph. But how about indices? Oh, yes, we’ve got the indices. We’ll look at indices in a sec.
Well, I’ll let this run, and I’ll look at indices now. So one of the main indices I trade is the S&P 500. So I have another account, an investment account, I trade S&P on. And I’m just going to have to slow that down for some reason there’s a glitch in MT4. When that’s running, you can’t switch timeframes. So, speed it up again. S&P 500. What do you think you need to do with the S&P 500 when you’re trading it?
Judging by what’s on the screen. Anybody got any ideas? Apart from you, Peter, because you know. Mm-hmm. Buy it. Only loans. The S&P is an investment vehicle. So it’s things like, people like Warren Buffett use it to just generate a quick 8% to 10% a year on their multi-multi-billion dollar fortunes.
So you only buy the S&P, yeah. On the chart here, we’ve got the 72 and the 24 moving averages. I’m going to cover this in more detail when I do the course, but the 24 is the monthly and the 72 is the quarterly moving averages. So these are institutional moving averages. These are what institutional reporting is based on. So with something like this, what you would do is you would just basically buy it. Yeah. So you would set the EA up to basically say, for example, on the four-hour chart, if I zoom out, this is the same moving averages for the daily chart displayed on the hourly. You would say basically when we push down and we’re above the 72 moving average, I want you to take long trades for me, okay?
And what you can use is something like the RSI. So on the S&P 500, I would set a strategy up that says when the four hour RSI is extended below 32, 30, 25, whatever you want, take long trades, and then get me out after it’s moved, whatever you want. Again, measure it. How big was that move? How big was that move? How big was that move? How big was that move?
What do you want to target? Up to you. You can set your target wherever you like. Trail it if you want to. But basically for the EA, what you would do is say RSI extended on four hour above or below 32 take long trades only In fact, let’s set it up and make it obvious What’s this doing? There we go So we take the profit on this one. Let me just stop this one So yeah, so there you go. That’s that’s that strategy running. So that’s the four hour RSI extension strategy, sellers, buyers, you would have got out here with a lot multiplier, you would have got into new trades there, you would have got out there with a lot multiplier, or advanced drawdown control.
There’s all sorts of ways you can get out of this, which I’m not gonna go into in detail here because this is just about the EA, it’s not about detailed strategy. But for S&P 500, what you would do is reset. You would say long trades only. Okay, I only wanna take long trades. For me, I’m a position trader. Yeah, if you wanna use a stop loss, use a stop loss. That’s fine.
The rules are gonna be pretty similar, aren’t they? But I don’t use a stop in that way. I have a stop and I’m using a stop on my portfolio of positions overall, but I would risk probably half a percent on the S&P because the likelihood of it not doing what it does is infinitesimally remote. So I’d be happy to risk a little bit more on it. I would use ADR. I always use ADR as a stop.
I would probably go one ADR with the S&P because sometimes it does have three to four day downs, which we’ve just experienced at the moment. So I’ll probably use one ADR as my stop loss multiplier. So using a stop ADR with half a percent, that would be my risk. And then what I would want to do is on the four hour when the RSI is extended below, let’s just pick 30, 70, this is something you can back test. Which of these is the best? 70, 30, 80, 20, 75, 25.
Go, go and back test it. So when that condition is met and the daily RSI 72 is below us. So we have to be below the 30 RSI on the four hour chart. Yeah, I want you to get me in to long trades. Yeah, for me personally, I would be, well, my eyes are going, lost where everything is. I would be getting in with as many positions as you need to for me, please.
And I want you to spread my trades out by one ADR and target one ADR. So that setting up there that I said about spreading out was targeting one ADR. Sorry, I’m getting confused with myself now. So long signals, Half a percent ADR, sorry, yeah, one ADR apart with my stock loss. My initial stock loss to be one ADR, sorry. That’s what that one was.
Half an ADR apart on my entries. Sorry, one ADR apart on my entries. I’ll get it right in a minute. I’m making this up on the fly basically. So forgive me for getting it wrong because I’ve not done it. You just asked me to put a strategy for S&P so I’m just doing it. Distance, one apart. Take profit in money, I’m not sure, but I’m pretty sure we’ll be able to get an ADR out of a move, yeah, at least.
Probably more. I mean, again, these settings you just have to play around with. But I need you to use fake stop loss so that you get me in with the right sizing. The higher time frame RSI, you can ignore that if you need to get into more than one position. And ignore the higher time frame moving average after you’ve gotten to your first position too, please.
I’m not gonna worry about spread. Let’s give that a go on the S&P 500. And I’m gonna enter my trades on M15. There we go, let’s try it. See what happens. We’re gonna, it’s gonna need to generate this tick data because I haven’t tested on S&P. So just give the, you can see how quickly it’s moving, won’t be long. I’m late here.
Do you use the MT4 optimizer facility on your backtesting? Yes, I do. I’ll show you that in a second. Apologies to the live room guys, if you’re in here. I know Peter’s in here, Russ is in here. No. Should be in live room now, but hey. We’ll do a live room in a minute. Right, so let’s just quickly visualize this and just see what this does.
Right, so let’s just quickly visualize this and just see what this does. A lot in this video, it will add to the archive, I hope. Yeah, I’ll put it in the archive. It’s going on YouTube, so we’re what, two hours in now? So, it’s a little bit more detailed than I was expecting it to be, but it’s all good. Okay, so we’ve taken a long trade because the RSI on the four hour will have been extended. You can see that the market has moved down.
Yeah, so the four hour RSI will have been extended. We’ve gotten with the trade, we’ve taken a profit. Yeah. Obviously, I’ve just set this to one ADR. So that’s just taking a profit there. You could set this, you could use all sorts of settings, but I’m just kind of made this on the fly, if you like. So pushing down, I haven’t got the dash on, so I can’t see what the RSI is on the four hour, but I would suspect it’s still extended.
No, it’s not. Right, so you see that hasn’t taken a trade. That’s because the four hour RSI is not below the 30 level. So let’s put the dash on and we’ll adjust that four hour RSI and see if we can get into some more traits. So dashboard, show the dash, and we’ll show the data. And what we’ll do is that higher time frame RSI, I think 30, 70, 30 is going to be a bit a bit too tight. So I’m going to go 60, 40 on that. We’ll start that again. Shut all these ones down.
Okay. So you can see the higher timeframe RSI is currently at 39.11. We told it to trade when it was below 40. So this will take a trade long when we get the next reversal alert there. Okay, and it’s gonna spread the orders out 7,156 pips apart. Okay, this is another reason we use ADR, yeah? This is a really good example of why we use ADR.
ADR on the S&P 500 is nearly 8,000 pips, yeah? What were we looking at on the last one we traded, 40? So ADR will auto adjust to a percentage of the instruments roughly movement every day. So we don’t have to worry about pips anymore. Forget pips, pips are utterly useless. Again, I’ll talk about this when I do a more detailed course on it, but you see all these trading gurus out there that say, I can guarantee you 400 pips a month, or join this service, 1600 pips last profit last month.
What’s that got to do with anything at all, yeah? I am making 9,000 pips on this trade. Let’s see what this trade was. I made 7,200 pips on that trade. How good am I? Not good at all, I’ve just made one trade. In and out one day. It doesn’t mean I’m amazing at trading, does it? Because I’ve made 7,000 pips, 9,000, it’s totally irrelevant. Next time someone says to you, I can make you 500 pips a day, ask them what they’re trading.
500 pips a day on the S&P 500 is literally a couple of candles. So what are they, a scalper? You see how irrelevant PIPs are. You need to start measuring your performance in ADR and in percentage gain on your account. Forget PIPs, mean nothing. It’s just a measurement of that particular instrument. A more accurate measurement is how often, how far that particular thing moves. It is totally true, Daniel, isn’t it?
I’ve been trading for 13 years and I’ve basically seen a hundred thousand of those adverts. I see them on Facebook, I would still pop up on my Facebook. There’s like 400 pips profit, find out how. Well, it’s easy. You press the buy button on the US dollar side, you make it in two minutes. That’s how. How much am I gonna make?
20 P? I don’t know. What’s that got to do with anything? It’s just rubbish. But unfortunately the market tends to work on pips and that’s where we’re brainwashed to do it. It’s wrong. It’s all wrong. Anyway, that’s for another day. So yeah, so you can see this is the S&P strategy for any of you that’s just joined. S&P strategy with trading. We’ve taken two positions on it so far on this down dip. So we’re trying to get into more positions by basically saying we’re happy for you to have pulled back a little bit looser is what we’ve adjusted the EA to do in this case.
So that trade wasn’t taken because it was only 4,000 pips away and we need our trades to be 7,000 pips apart. Yes, it is recorded. Yeah, there is too much in this video. This was meant to be a quick overview of the settings for the launch of version four. Unfortunately, it’s turned into a massive strategy session. But this is good. I don’t mind. I’m happy to spend time doing it. It’s not a problem. Because I just want to show you basically ways that you can test, because this is where the problem is. And it’s people testing. This EA is a… The people that are trading with it and making money will tell you how good this is.
It’s not good because of what it does. It’s good because of how you use it. And this is the bit that I’m going to be teaching everybody. And the best way to use this EA is to position trade with it, which is what I’m showing you now on the S&P 500. We’ve had three trades with one or more. We haven’t taken a lot, but we haven’t used ridiculous lot sizing that most people use. And this is part of the problem.
So, but yeah, this is the strategy. So Daniel, was it Daniel? It was Daniel, isn’t it? Yeah. The ones that need to make an S&P 500 strategy. There you go. Let’s have a quick look at it. On control points, on a graph. Let’s let it run for, no, I’m not gonna let it run for a year, but let’s just have a quick look on the graph because we’ve got a whiz through trades.
We only took one, two, three trades there, didn’t we? So, this will obviously start to, what size account am I using here? No idea what size this account is I’m testing on, but anyway, ignore the drawdown. It’s probably gonna be wrong, but yeah, we can look at the chart, but that’s how easy it is to trade. How easy it is not to trade, how easy it is to develop a strategy with the EA.
You just need to know how to use this tester to develop it. So you look at a chart, you go, right, I can see on this chart when it gets up here, it tends to come down. And when it gets down here, it tends to go up. So I think I’ll use that as a basis for my trades. What I’ll do is I’ll get in on a lower time frame, because I understand multi-time frame analysis because I’ve done Leeds Pro Course. And I’ll basically start taking positions in that direction when it gets down there. Because I know, and I can see on the chart, every time it does that, it does that.
Every time it does that, it does that. Every time it does that, it does that. That, that, that, it’s not rocket science trading, it’s really easy. But you just need to identify market movement and come up with a strategy, stick the EA on, say, next time we get a push in that direction, i.e. a reverse ruller in that direction, and the conditions that I’ve spotted have been met, take a trade and just see what that does. If this profit curve goes like that, happy days. If it doesn’t, scrap it, try a different setting. Yeah, I’m giving you some settings here. As I say, how long have we been in here? Literally developed this strategy in two minutes and put it on here and we’ve made 700 pound.
800 pound in six trades. This is on the fly, I’ve done this live with you, yeah? I haven’t magically done it, but I know the S&P, so I’ve got a bit of advantage, because I know the S&P, I know how it works. All I’ve watched this session so far has been impressive. Thank you for making an awesome EA. This matches my exact currency’s current strategy. We’re looking for ways to automate it. Cool.
Yeah, trading’s easy, guys. These guys from the Pro Course here that know how I trade, and the way I trade is totally different to the way everyone else trades, and that’s why it works. It’s the way I think it works, anyway, because I don’t let the market have my money. I wait for the market to give me its money when it’s moving in my direction. So what goes up must come down. This chart demonstrates what I do to a T, the S&P. Buy low, sell high.
Buy low, sell high. Buy low, sell high. Buy low, sell high. I don’t know when the low is, so I’ll get in here, here, and here, but I know it’s going to do that. I get in here, here, here, because I know it’s going to do that. I get in here, here, and here, because I know it’s going to do that. I don’t get in here, put a stop there, let the market have that, get in here, put a stop there, let the market have that, get in here, put a stop there, let the market have that, then let the price go in my direction. What’s the point of that? Sounds simple, doesn’t it? It is, but I’ll show you how to do that. But yeah, I’m not gonna let this run forever because we’ll be here all day.
But yeah, eight trades, you can see what it’s doing. So I have got some set files. I was gonna go through all of them, but there’s a lot, we’ve covered an awful lot in this. So the set files I’ve got tested and profitable. I’ve got more than this, but this is a starting point. We’ve got an ADR reversal. We’ve got a hedging strategy. We’ve got yesterday’s high, low, and we’ve got a piercing yesterday’s high, low strategy.
We’ve got mean reversion and a trend pullback strategy. That’s the one that someone sent me the other day, but these ones, so I can stick the set files out for those and have a look at them, play with them. I’ve come up with these literally in a day of just chucking stuff in based on strategy that I know. They’re not gonna be 100% and there’ll be a lot of room for improvement. The worst case scenario, if you stuck every single one of these on pound US dollar on a separate empty four with 3000 pounds in it, in a year’s time, you’ll have about 15K.
And I haven’t even optimized them. Which brings me on to quickly before I go, optimization. So you asked about optimization. Still only taking eight trades up. Optimization, the way that I use optimization is, when I’ve got a strategy that works, so like this hedging strategy, for example, it will have parameters in it. Yeah, so I will have this set up and it will be profitable, okay?
But I’m not sure whether it’s the best way to trade this particular strategy. So with hedging, I don’t know whether having my stop loss half an ADR apart, or a quarter of an ADR apart, or one ADR apart is gonna be the best. Yeah. So what I’ll do is I’ll put that into the optimizer. And I will say, right, just tell me what the difference is between a quarter of an ADR and one ADR.
Yeah. And what that will do is it will run four optimizations for me. So it will basically try a quarter of an ADR, increase it by a quarter of an ADR to give me half an ADR, increase it by a quarter of an ADR to give me 0.75, and increase it by a quarter of an ADR to give me 1. So I’m saying, start testing at a quarter of an ADR, finish at 1 ADR, and step up by 25% each time. So what that will do is it will give me four free results, 25, 50, 75, and 1.
I’m sorry, four. 25, 50, 75, and 1. And it will tell me whether or not I’d be better off having my initial spot loss one of those apart. I could also run it on the moving averages, which is, sorry, on the RSI in this case. So we’re using the RSI filter here. Which would be best? The 14 or the 21?
I don’t know. So test the 14, step up by 7 to give me 21, and the 21. 14 and 21. So I just want to test on those two. Would I be better off using a 21 or a 14 RSI? If the 21 comes out more profitable, I’ll use that. Yeah, tested that. So I’ll change it now to a 21, because I know the 21’s better. So I wonder if, instead of targeting half an ADR, I’d be better targeting an ADR. So let’s try. Let’s maybe say I’ll start at a quarter of an ADR, go up a quarter of an ADR to one ADR. So give me the results of should I be targeting a quarter of an ADR, half an ADR, 0.75 of an ADR, or one ADR. Which of these is going to be the most profitable for me on that test? So that’s how I use the optimization setting.
And all you do, obviously, when you click that box is you click optimization and it gives you optimization. Here’s an optimization I ran earlier. That’s lucky, isn’t it? Got one in there. So here’s an optimization I ran. I was testing the difference between distance between orders as a quarter or 0.75 and my percentage profit of ADR as 0.75 or 0.5. And you see here, it gave me the different, the drawdowns.
So if you’d have used that one, you’d have went into 7% of drawdown and made 1500 quid in a year. If you’d have been on that one, you’d have made two grand with 14% drawdown. If you’d have used that one, you’d have made 16. So it’s pretty obvious here, isn’t it? That’s the best one, low drawdown, second highest profit, the lowest drawdown. We’re gonna use that.
So with this particular strategy, which is the piercing yesterday’s high-low M5 scalping strategy. No, it’s not, it’s yesterday’s high-low. It’s a close outside yesterday’s high-low hedging strategy. It’s better off to have all your entries a quarter of an ADR apart, targeting half an ADR. I know that because the optimizer told me it. And then what I will do is I will go in to the EA, set that up, and test it for an entire year on every tick, just to make sure that what that optimization report said is actually true.
And if that comes back as a tick, there we go. Job done. So yeah, so that’s, that’s somebody asked about optimization. So that’s optimization. Many thanks for the session, sorry, need to go. Yeah, I’m not surprised, but people’s stomachs are rumbling. We’ve been on for two hours, 20 minutes. Are you planning to include divergent filters in the future?
No. Divergence, there’s two reasons for that. Divergence is quite difficult to detect accurately and it’s too variable. So with divergence, I don’t like any indicator. The reasoning behind this is I don’t like any indicator with too many settings. Okay, so the RSI is simple. What is it? 14 or a 21 or a seven, that’s it.
You can’t go wrong, right? So if you set it to that and you hit that, you can see it. If this had six different settings, therefore six times X combinations of settings, I don’t know, 48 different variables I could use to make this look different. How on earth are you ever going to know whether it’s accurate and reliable? If it’s got one setting, one number, and you can change that one number, it’s really, really, really, really simple to back test.
With divergence, you can measure divergence over a number of candles. And you can measure the angle of divergence. So I’m just highlighting a divergence on the screen here for those who don’t know what divergence is. Price is moving down, RSI is moving up. That indicates that there is strength in the currency, although the price is declining. So that’s basically an RSI divergence I can see because I’m measuring it over that many candles.
If I was to measure divergence over less candles, for example, that many candles, I don’t have a divergence. So if I put divergence into the EA, what do you use? Everybody’s gonna use something completely different. And what you will do is you will curve fit the EA to the best divergence. And that isn’t how divergence should be used. Divergence is a visual thing. It’s very subjective. Yeah, that’s right.
Too many variables within an indicator mean that you can curve fit it. And curve fitting is basically where what I do is I adjust it so that it fits my needs that I can see on the chart. So every time this gets up here, I adjust it so that it triggers there. What you’re doing is you’re adjusting your indicator to match historical data. Historical data is zero use moving forward because what’s happened in the past is not gonna happen in the future necessarily.
If you can change the settings. Yeah, RSI, this is the reason I love RSI. People hate on RSI and I don’t know why, it’s awesome. The last two weeks, yeah, what has the strength of this currency been? If it’s been really strong for two weeks, or it depends on obviously what timeframe you’re looking at, but the RSI has been strong for X number of weeks, I know that there is a profit take move coming. I can’t fine tune this to other settings, which will allow me to make this, hit this at exactly that point, because it’s never gonna do that in the future.
That’s not how the market works. COVID comes along. Do you think the RSI divergence is gonna make any difference? It’s gonna collapse. You just have to deal with the market as it gives you movement. And divergence is great, but for me, it’s a confluence. It’s a confluence indicator. I used to use it a lot.
I found it becoming less and less and less useful because it’s only drawn when this is up here. So when this is up here, I’m getting in. If that line is there or not, so let’s say we get here, right? I’m not gonna not get into the trade because that line’s there, not there. Yeah, that’s basically what I’m saying with divergence. It’s good, a lot of people trade on divergence. And this is the thing, indicators are subjective.
They are down to you as an individual. If you like it, use it. If you find it useful, use it. Yeah, but if you don’t find it useful, scrap it. I personally have found it useful in the past, but I find it an overcomplication. So I will be now, instead of going, when this gets up here, I’m going to start taking shorts, I’ll be going, I haven’t got divergence. I won’t take the short. Boom. I knew I should have taken the short. That just makes you cross. When you get cross, you overtrade and revenge trade. When you overtrade and revenge trade, you blow accounts. Keep it simple. The simpler your trading is, the less moving parts it has, the easier you will find it.
When that goes up there, typically it goes down there. So I will get in. Don’t need anything else. And you’ll find me talking about this a lot in the course. So anyway, are you planning to do, dun, dun, dun, dun, dun, dun, dun, dun, dun, dun, dun, too many buttons, too many variables, yep. Subjective, what RSI settings do I use? I use the 14, median. Again, if you wanna use close, use close.
Yeah, look at the difference. There’s just not enough in it to make a difference. The median I like because it’s smoother and the median matches the TDI RSI better. So the traders dynamic index is another indicator, which is totally over complicated. So this is a TDI. Probably on 21, yeah, 14. So I’ll set TDI 14 up. The line you’re looking at is the green.
So there’s not a lot in it with the, so this isn’t a good one, this is a bad TDI, sorry. There’s loads of TDI indicators out there, but basically all the TDI is, if you know about the TDI, is it’s an RSI with a load of extra confirmation lines. So look at my, let’s say, my strategy is RSI 14, buy when it’s down there, right? TDI strategy is involving a Bollinger band and three moving averages within this on top of an RSI. How complicated is this?
How easy is this? It’s not rocket science. It doesn’t have to be rocket science. The reason people develop complex indicators like this is to sell them to you. Market science. The reason people develop complex indicators like this is to sell them to you. Wow, this thing’s amazing. Look, when that gets down there, that gets down there, that does that, and that does that, you take a trade and then it draws an arrow and you get in and yeah, it’s brilliant.
It just draws an arrow for you. It does the same thing. When it gets down there, it goes up. Look. Anyway, don’t get me started on TDI and other indicators. That’s that. So yeah, I use the 14, sorry, your question. I use the 14 on four hours and above. So daily and four hour, I use the 14. On the hourly and below, I use the 21.
The only reason I use the 14 on the four hour is because you need slightly faster RSI because the RSI 21 will you’ll find it very difficult to get to an extended condition you can see here. It struggles to get extended in any shape or form the 21 when you go to four hours and above. What it does though, when it does it’s amazing but you’ll get a lot less opportunities to get in. With the 14, it will give you more opportunities to trade. So on the, and again, I’m kind of telling you what’s in the course. This is one of the lessons in the course, is trading opportunities based on multiple timeframes and this is basically part of it. If you adjust your indicators to the right timeframes, rather than using one setting of an indicator on all time frames, you’ll find them much more effective. You just need to back test to find out what those settings should be.
And that’s as easy as changing it, eyeballing it, better or worse, better, keep it. It’s like going to the opticians. You know you go to the opticians if you wear glasses, right? So they sit you there, and you’ve got these horrible glasses on that are like out of some weird science fiction program, like a steampunk thing. And they change the lenses in them. They make you read off of a board. And they put a new lens in, and they go, better or worse? You go, worse. They change it out for another one.
Better or worse? You go, better. Brilliant. They keep that one. And then they move the other one. They go, better or worse? And you go, better. And they go, what about this one? Better or worse? Worse.
OK, we go back to the old one. It’s exactly the same when you’re checking out indicators. You change the settings. If it improves the accuracy of it, keep it. If it doesn’t, get rid of it. Again, not rocket science, people overcomplicate it. So yeah, basically that’s, I’ve kind of covered everything I wanted to cover. Where, so does the course come as a separate page?
Right, so at the moment, I’ve got the pro course obviously on the website, which you can go and sign up to. The pro course and live room is what you’re signing up to. The course is the course, the vast majority of the benefit you’ll get is being in the live room with me and seeing how I trade and learning from what I do. So the course I’ve decided to re-record live and give out to everybody for free, right? But you will still have to, if you want to trade with me, you still have to pay to come in the live room. It’s 50 quid a month. It’s nothing for what you’re getting, I think anyway. So you can go and sign up now to the Pro Course if you want to and take the Pro Course and come in the live rooms. But next week, hopefully I’m gonna start to deliver the Pro Course live on Zoom like this.
It’ll be in two hour sessions and it will be recorded and then it’s just gonna go up on the website so everyone can use it. And the idea is I want to teach you how to trade properly as a position trader. But if you don’t like position trading, don’t do it. But watch it and if you like it, do it. If you don’t, don’t. It’s up to you. I’d rather put it out there because this EA that I’ve built is designed for position trading.
It was designed and built for the guys that I trade with in the live room in the Pro Course to automate the way that we do this. The way that we do this, yeah. Bank profit every day. My target is 10% a month, 10 to 15%. My target is 2.5% a week, yeah. Yeah, that’s what I do every day. I take multiple positions, I manage my drawdown with drawdown control, and I bank regularly to build up a profit.
And that’s what I do. Yeah, and this is what I’m going to teach. It’s position trading. I don’t use a stop. I don’t let the market take my positions away from me. But then again, I don’t use ridiculous size lots like 0.1 lot because I’ve got a $1,000 account. Ridiculous, way over leveraged. You trade like this, position trading, the way the market trades, yeah?
Banks don’t enter a hundred lot position with a 10 pip stop loss, because when it hits that stop loss, they will lose a hundred million quid or whatever the, I don’t know what the figure is, it doesn’t matter. But my point is, the banks don’t do it, funds don’t do it, stockbrokers don’t do it. Why do we do it as forex traders? Why do we put these orders in the market that we know the market’s gonna take?
We know the market’s gonna take them because when we put them in, we get stopped out 50% of the time. How crazy is that? So I teach you how not to do it. Do it the way that the 5% do, not the 95. So it’s really easy. Yeah, don’t be the popular kid at school because the popular kid at school never makes it. The nerds rule the world.
I’m a nerd. I’ll teach you how to become a nerd. Holding trades for weeks. No, no, no. Holding trades. Holding trades. Taking a position. Position trading is taking a position on the market, right? What’s your position on the S&P 500 right now? Long.
Yeah? Would you ever take a short on it? No. You need a reason to take a position on the market. Whether you get in there, there, there, or there is irrelevant. Market will do that, it always does. If the market goes up, it has to go down because every time you hit the buy button, you become a seller.
To get out of your position, you have to hit the sell button. When the sellers start, the sellers join in. When the sellers need to take profit, they hit the buy button. The market moves like this. Why do you think I’m called the market structure trader? Market structure is what the market moves on. I take advantage of the structure, but I don’t get short, put a stop, wait for the market to come and take my stop out and then move down to my profit target.
That’s ridiculous. But that can, if you’re trading that timeframe, yes, it’s weeks. That timeframe, days to weeks. That timeframe, days. That timeframe, a day or two. That timeframe, in and out today. Market movement, market cycle is the same, yeah? Everybody sold, right? When these people sell, they’ve got to hit the buy button to get out.
What happened next? This happens every day on every single timeframe, on every single chart you look at. Up, down, up, down, up, down. Everybody that bought there had to take a profit. Everybody that bought there had to take a profit. Everybody that bought there, it’s really, really, really, really simple, but people don’t see it for some reason. And that’s what I teach. I know I’m not going to go into that in detail because that’s another thing. So if you’re day trading, position trader’s a day trader, that’s fine. But bear in mind your day trades may turn into week trades. Because if the market doesn’t decide, if you want a day trade and you want to go short here, doesn’t hit your TP and it goes up to here, and then it doesn’t hit your TP and it goes up to here, you might have to wait until here to get out.
So your day trade that you took short there, that you didn’t get out of, took one, two, three, four, five, six, seven, eight, nine days to get you out. But do you want to be right or do you want to be profitable? Big difference. Anyway, I’ve got to do the live room. If there’s anybody still left, Peter’s still here. Are you still awake, Peter? I’m not sure there’s anybody else in here from the live room, is there? Okay. Oh yeah, Dan’s here, that’s cool. Yeah, so I’ll leave it there. I’m going to put this recording up. I’m not going to edit it, I’m just going to stick it up there.
This is good. It’s been a lot of waffle, but it’s two and a half hours of this is now you know everything you need to know about the EA, you’ve got a load of extra gold in there as well so I’ll stick that up on YouTube when it’s ready, when Zoom’s rendered it. If you’ve got any questions, obviously the Telegram group, you can come into the Telegram group if you’re not already in there. In fact, you should all be in there because I’ve only put this in the Telegram groups. You guys obviously are in the Telegram group already. But obviously the EA’s out there. If you’ve got any questions or anything, you want any help with backtesting, if you want any clues on set files, just ask away.
I’m always in Telegram and I’m always responsive. So just ask if you need anything. But I’ll leave it there and I will do the live group for the guys an hour and a half late, an hour late. And yeah, just let me know if you need anything and thanks for coming and going through it and hopefully you enjoy. I’ll chat with the set files in the Telegram group. They will also be linked from the EA page on the website. I’m going to set up a separate blog post with the strategies in, just to explain what they’re doing and what the settings are in them as well.
So it’s going to take me a while to do that. So I’ll shut the set files up, but I will prepare the document. If I get a chance this afternoon, I’ll do it this afternoon, if not, I’ll probably be early next week. All right. So I’ll get that done. Okay, guys, thanks for coming and have a good afternoon. And yeah, anything you need, let me know.
Otherwise I’ll see you soon.




