
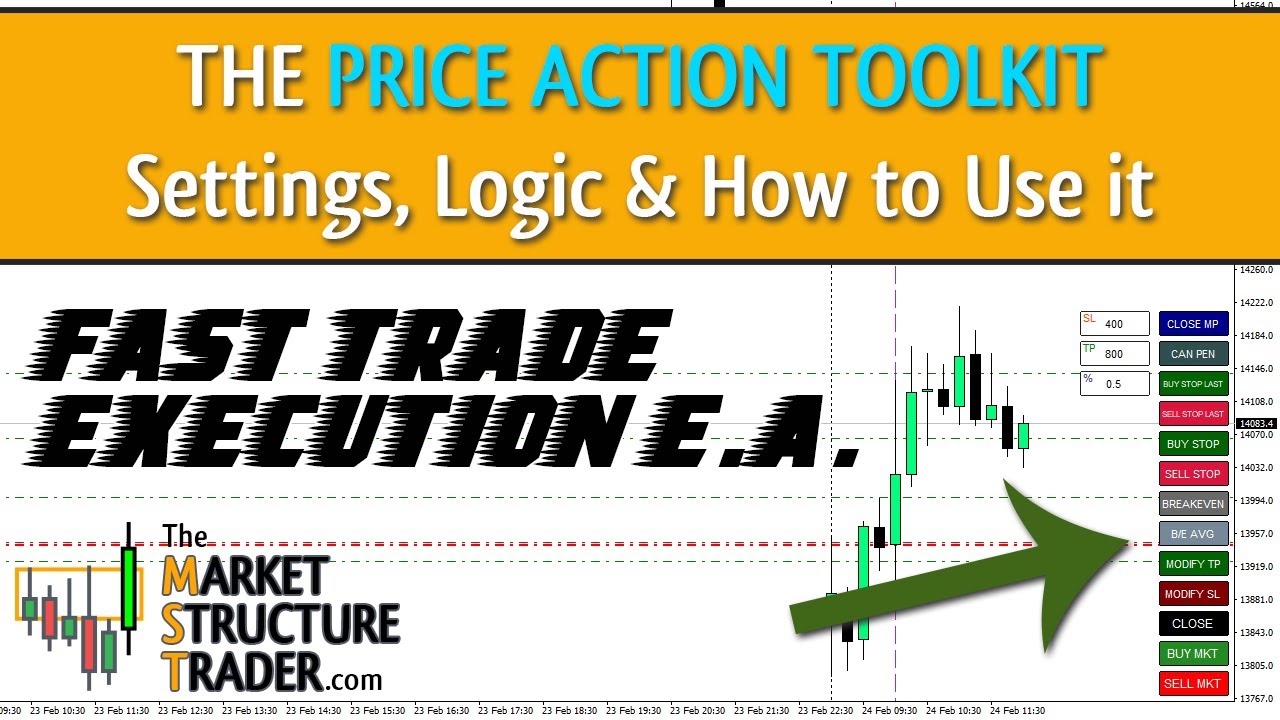
An overview of the Price Action Toolkit EA and what it’s designed to help traders do.
👉 Get the Price Action Toolkit EA here: https://www.mql5.com/en/market/product/78238
👉 Market Reversal Alerts EA To Automate Your Trading: https://www.mql5.com/en/market/product/65383
👉 All Indicators Used On My Charts Are Available Here: https://themarketstructuretrader.com/the-indicators/
👉 The FREE Position Trading Bootcamp Course is Here: https://themarketstructuretrader.com/category/the-position-trading-bootcamp/
👉 Join Me & Position Trade Daily For Free In The Live Room Twice a Day: https://themarketstructuretrader.com/the-live-room/
👉 Join The Community Chat on Telegram Here: https://t.me/market_structure_trader_chat
Video Transcript
So, Morning all, how’s everybody doing? Thanks for coming into this live stream. This is a bit of a special live stream because I’m just doing this to give a settings overview on the new Price Action Toolkit EA. So there’s going to be no analysis or anything in here, it’s just a settings overview and to get a little bit of feedback from you guys as to anything you’d like to see changed or any additions you’d like to see in it as well. So if you can just keep questions until the end if you can. If you want to ask them in the chat while I’m going through this that’s absolutely fine but I’m not going to answer questions on the fly as I’m going through this because I want to just rattle through basically all the settings and explain what the EA does and how it works and then obviously we’ll have a question and answer session at the end where we can have a look at everything in more detail. Okay so to get started for those of you that are not familiar with EAs basically when you’ve purchased an EA through the marketplace it appears in your expert advisors market folder mine is actually sitting here because I haven’t purchased it through the market but it will be sitting in there. So to activate it all you do is literally just drag it onto the chart and then you will get the settings. So one thing you need to be made aware of and make sure you have checked is the allow live trading checkbox. That needs to be checked and then in the inputs section we’ll go through all of these settings in due course but the one thing that you need to be made aware of is the magic number.
Actually the magic number will appear on your EA at the top here in the miscellaneous functions section but you just need to make sure you have a unique magic number for every instance of the EA, okay? Because the EAs work on magic numbers so they know which trades they’ve placed and which trades they are managing. So make sure that is a unique number for every instance you put onto a chart. Okay, so I’ll click the OK button. That places the EA onto the chart and we’ll do a quick rundown here of what you can see on the screen to start off with. So at the top here we have input boxes. All right, so what these will do is they will allow you to change on your chart on the fly the TP Stop loss and risk settings for every trade that you take. Okay, so the top one there is SL Which is your stop-loss TP is your take profit and percentage is your risk and that is the percentage risk Of your balance you are going to place on this trade and your lot size will be auto-calculated for you based on your stop loss, all right?
So that setting up there is basically the default. And as you can see down in the bottom left-hand corner here, we have a stop loss mode, which is defaulted to pip amount, okay? So what this will do is we’ll place your stop loss, a pip amount or a point amount away from your entry. So what I’ll do is I’ll quickly take a trade now, price is coming down, okay, so I’m going to take a quick sell here at market, just by pressing that button, and as you can see it’s placed an entry and it’s put the stop 400 points away from my entry, my TP is 800 points away from the entry as well, okay.
So that’s basically what those are, and the lot size here in this case is 1.14 has been auto calculated for me based on half a percent risk for 400 points. Now this is a $10,000 account so as you can see it’s risking 50 odd dollars on the trade for me. I think the actual balance on this account is just over $10,229. So that’s basically how it works. If I decide I want to get into a new position with 1.5% risk, OK, I’ll take a new position there. And what it will do is it will add a much larger position. That’s 3.43 lots.
So a much bigger position because I’m risking more. Now, there’s different modes as well you can have for taking positions. You can either have stop-loss mode there, or you can set it to be last candle. And what that will do is it will place the stop above the last candle if I zoom in. So last candle mode will actually place my trade here now but it will place the stop loss above the high of the last candle. So if I hit sell now you can see that stop loss has gone in there.
It slipped a little bit so it’s just under the top of the candle but it’s basically placed Basically placed it there and obviously I’m on one minute charts. We get a bit more slippage And the other setting or the other stop-loss mode that you have is This candle so if I place a buy order, I’ll wait for this candle to get a bit bigger. Let’s just close these out quickly I’ll wait for this candle to get a bit larger and then we’ll be able to see where that places it So there’s the high of this candle and the low of that candle and there’s an offset of 10 pips there Roughly and then obviously my TP goes up there. You see the lot size. It’s taken now is 23.89 long. Okay. So those are the modes you can change those by just hitting the stop-loss mode button and it will flick between last candle this candle and Pip amount. Okay, just got stopped out in that trade there Wasn’t a trade I was taking obviously to make money, but and and this is obviously a demo account I’m not taking these massive trades, obviously So basically, that’s how those Risk functions work. Okay, and the idea being is if you see a nice setup So let’s say for example, that’s a nice pause candle and before that we had a hammer So I’m looking to go long what I can do is say I want to get long and I want to place my stop under the last candle and I can place a pending order above that last candle as well.
So I can place a buy stop above the last candle and the stop loss below the last candle. So it allows you to enter the market in any way you see fit. So I’m happy if this now is going to reject down here and push up higher that I want to get in when we break the high of that candle and my stop is going to be there. So I’m looking for a momentum move to get me into a position long. And at any time I can cancel those orders with a cancel pending button. So looking at the buttons we’ve got, the buttons are pretty self-explanatory hopefully. Sell at market, press that and it gets you straight into a sell order. And obviously it’s placed my stop above the last candle because that’s what I’ve got set.
And obviously there’s a bit of slippage there. We can change that as well, which is the pending order and stop loss offset in points. It’s set at the moment to 10. You will get a bit of slippage when you’re placing orders, especially on one minute charts. So what you might want to do is maybe increase that to 20 points so that it places it a little bit further away. So you can adjust that in the settings.
And obviously if you want to measure, if you click your middle mouse button, that’ll bring up your crosshair or you can hit Control F on your keyboard to bring up the crosshair. You can measure what it’s gonna be placed at. So there’s 20 points. 10 points was obviously very, very, very tight for this particular instrument, which is the DAX. So that’s basically how that positioning works.
So obviously I’ve done a sell order there and I’ve sold at market if I want to buy up market I’m just going to change this to pips quickly Just close that trade out if I want to Buy at market I just hit the buy button and that will automatically place my TP and stop-loss levels as you can see at 400 And 800 these can be adjusted as you like So if I wanted to say actually I want a 200 pip stop-loss I can adjust that there and I can hit the modify stop loss button and it’ll adjust my stop loss up To the new level that I’ve set equally wouldn’t recommend this But if you want to extend your stops You can just hit the modify stop loss button and the same for your TPS So if price is moving in your direction you think actually this is going to go higher You can modify your TP on the fly and this will modify the TP for every single trade that you’ve taken So if I take another buy now, I’ve got two positions on there and I decide I want to go to 1800 TP.
I can modify all my TPs at the same time and it moves both TPs up there for me and the same with my stop losses. We’ll move them at the same time. Just close that trade out. Nice 1.1% profit there. Obviously I’m not trading any particular strategy. I’m just hitting buttons at the minute. But anyway, that’s how it works. As you can see, I hit the close button there. The close button close out every single position that you have and I’ve covered the modify stop loss and modify TP so you can see what they do.
Now if we take a buy here with one new position you can see there’s an orange line drawn in that is the average price of the positions that you have. So if I take another buy down here you’ll see that the average will now move so that it is between those two positions so that is now my new average price that I have at the moment and obviously you can see the profit percentage for your position is displayed there. We’re risking one and a half percent so we should be taking profit in a percentage basis as well. What I can do, I’m just waiting for price to move hopefully up here, is I can then move my stops automatically to break even at any time I want to.
So you have two buttons here for break evens, one just called break even and one called BE average. And what that is, that is break-even average line so if you hit the break-even button I need some trades to go into profits I’m just going to hit another one down there when your trades going to profit if you want to move your stops to break-even if you hit the break-even button what it will do is it will automatically place your stop losses at break-even for every individual trade that you have open. So hopefully price will push up and I’ll demonstrate that for you in a second. I had a nice big strong closed candle there.
So hopefully we’ll get a big momentum push in a second and I can demonstrate that for you. If you hit the BE average button, what it will do is it will move all of your stop losses to this orange line, which is your break even average. Okay, so there we go. So if I hit BE average now, you can see all my stop losses will have been put to that one level on those trades. So they’ve all been moved to 13883.5, which is that level there. If I hit break even button on its own, you’ll see it removes all the break evens individually to each individual trade.
So they all now have different ones set. OK, so that’s basically what those buttons do. I’m going to move the break-evens back to average there. And then obviously if I want to as well, good time to demonstrate this button. We’ve got the close MP button. That closes your most profitable trade for you. So if I hit that button now, the most profitable trade at the bottom is automatically closed out and then I can quickly move my break-evens to the new average. So I’ve locked in some profit and I’ve also locked in all those trades and I can’t make a loss.
Okay, and anytime you can just close out another more profitable trade and then move to break even to protect your profits and then just close out when you’re happy with everything. Okay, so that’s basically demonstrating how all of those buttons work. The other buttons I will show you now are sell stop, buy stop, sell stop last and buy stop last. Buy stop and sell stop will place a order at the candle that you are currently on. So this one here in this case. Buy stop and sell stop last will place an order at the high and low of the previous candle, the last candle. So if I hit now buy stop, it will place it above the high of that candle, which was when I hit it.
If I now hit buy stop now on this one, it will place it above this candle here. Okay, so it places it on the candle that you’re on. If I want to cancel them, I can click the cancel pending at any time and just get out of those because price is moving against me. I don’t fancy them, don’t want them anymore, so I can just cancel the orders and get out of the trades or get out of the pending orders. If I hit buy stop last, you’ll see that it will place a buy stop above the last candles high. And if I hit sell stop last, it will place a sell stop below the last candle obviously you wouldn’t place a sell stop last there because Prices actually below that level, but if price was to push up Further up to here, and I hit sell stop last it will place the sell stop below that candle there, okay?
So that’s an overview of all the buttons that we’ve got there, so this is what the EA is designed for. It’s something that’s lacking in MT4, which you find in a lot of other futures trading platforms like NinjaTrade or Tradeavate. You have quick trade buttons to get in and out of the market fast. If you’re scalping low timeframes, like M5 or M1, you need to be in and out quickly. So if I hit sell stop last now, it places the order underneath that low of that candle.
So I’ve got a pending order now bracketing where we are. Whichever way price moves now I’m going to get into a position and hopefully that momentum will carry me forward so I can get out of the position fast. Okay and this is obviously on a five minute chart now. And obviously I might decide actually there’s a really nice potential resistance there that would support which probably will turn into resistance if we get back up there. So I might think right I want to actually set my TPS there so if I’m going to get into that long there I want to actually adjust my TP to be 1200 to make sure that I have my TP out before we get to that level and obviously once the trade is triggered then it will adjust the TP haven’t got a trade on at the moment but if I hit the buy now obviously their trade goes there and I say actually I want that a little bit higher than that and I can modify my stop accordingly and also with my stop losses as well okay so just close that position out. Making some good profit here aren’t we?
Not doing too bad but anyway we’re not here to make profit. This is a demo account anyway. So that’s the trade functions and I’ll just cancel those pending orders off. So what I’m going to do now is go through the settings to show you all the settings and what they all do so we’ve covered the Pending order and stop-loss offset and that is basically the distance It will place the pending orders when you place them and this is for automatic automated trading and for manual trading with the buttons I’ll look at the automated trading functions for you in a second as well and Sorry, the the main buttons we’ve got at the top here The miscellaneous functions are the show trading buttons, true or false.
If you set that to false, the buttons will not show, neither will the entry boxes or the stop loss mode button down there. If you have activate buttons in tester set to true, this is mainly for the strategy tester. You don’t, it doesn’t affect it if you put it on a live chart, but if you want to use the EA in the strategy tester and actually use the buttons to take trades in the strategy tester ie practice trading practice scalping That will allow you to do that So these buttons will actually be functional all of these buttons will be functional in the strategy tester The only bit you don’t get in the strategy tester is the input boxes. Those don’t work in the strategy tester So if you were to use this input for activate buttons in tester tester it would automatically use your stop loss and take profits basically that you enter in the target and profits section. Next to each section as well that we’ve got in the settings it says buttons and auto on the ones that affect both buttons and automated trading because you can use this as an EA to just automatically get you into positions based on price action candlesticks which obviously we will cover in a second as well.
So that’s the miscellaneous functions. Risk, fairly straightforward. Risk of balance per entry, 0.5 is the default. That is what will appear there when you activate the EA. And obviously you can change that on the fly as you wish. But as default, it comes in at 0.5. So it’s half a percent risk per trade. And that is calculated on your stop loss. So your lot sizing is auto calculated for you so you don’t have to worry about what size position to take when you take a trade. You’re automatically going to risk half a percent in this case based on wherever you put your stop loss and that will auto calculate for you. Scaling in. This is an area that I added in because it’s something that a lot of traders struggle with which is adding into winning trades. So when you’re trading, particularly scalping, but this is true of all trades that you take, people find it difficult to add to their winning positions.
And when a trade goes in your direction, if you were to go long here and all of a sudden we’ve got a big propulsion candle going and then another big propulsion candle, the temptation is actually to take profit. What you should be doing is waiting for a pullback and continuation because your trade is working out. So you should be adding into your position, bringing your average price up and scaling into that position, assuming that you are going to be correct. That obviously maximizes the profit that you’re going to make when you get a trade right. So rather than taking profits quickly, which is what we all tend to do, you should be adding to positions when you get them right. So scaling to winners will do this automatically for you. When you set that to true it will automatically add a new position based on a distance between entries. So if you were to get in for example here and you had this set to 100 points as price moves 100 points in your favor it will take another trade and as it moves another hundred points it will take another trade and as the price keeps going in your direction it will keep scaling in enlarging your position which will obviously exponentially increase the speed of your profit that 1.5% or whatever the profit will get much bigger much quicker if you add to your position as it’s going in your direction.
So you can adjust the amount that it will take trades at and obviously again this is in points so 100 points or 400 points or whatever you want to scale in at and that will be dependent on the ATR of the pair that you’re trading typically. You can also scale in on candle close not tick. So if we let’s just set this to 50 and see if we can get it to scale into this position which is going in our direction at the moment long. So what I’ve done is to set it to 50 so it’ll get in pretty quick, which is there. Okay, so you see it’s taking a second position because we moved up 50 pips. Obviously 50 points in this particular case I probably would think is a little bit too close together to scale in.
But just to demonstrate the point, obviously now it’s adding a new position in there. And you saw it added it in while this candle is moving. The other option you have is to add two winning positions only on candle close. And what that will do is it will wait for this candle to close. And if the close of this candle is more than 50 points from the previous entry, it will add a new position. Okay? So if this candle was to close down here, it wouldn’t be 50 points higher than the last position. It added it. It wouldn’t add a new position. Okay. So you can have it either automatically getting in as price moves and if you get one massive propulsion candle like that, it will have scaled in like that for you.
And by the time you get up to there, you’ll have an absolute fortune in profit. Or the other option obviously is you wait for that candle to close and it will take one position up there. Okay. And that’s what that option is. So you have the option of getting in very, very fast or getting in only on candle closes. And again, that’s a personal preference and it depends really on what time frames you’re trading and how aggressive you want to be. Targets and stops fairly self-explanatory stop loss per position is 400 points that is what feeds into here initially and your take profit 800 or whatever you want it to be. You can also use ATR instead of a fixed stop loss and take profit so if I set this now to true, you can see we’ve got the ATR to use set to five, and we’ve got a stop loss ATR multiplier and a take profit ATR multiplier here too.
And what this will do is it will take the ATR five of the instrument that you’re on and the timeframe that you’re on, and it will place your stop loss one times that number behind your entry and that two times that number ahead of your entry if you will take profit. So basically what that is doing is using the ATR of the pair which is displayed up there when you have that set on which in this case is 444 to automatically place your TPs and your stop losses.
Okay, so that’s basically what that function does there. And again, you can adjust these multipliers as you see fit. And just close those positions out in a minute. Sorry, just testing that one a sec. Right, so that’s those. Those apply mainly to your automated trading, which we’ll cover in a second. Exit strategies. Auto exit at percent profit target. So what this does is when you hit a certain profit target, in this case I’m going to set, let’s say, let’s just go for, I’ll tell you what we’ll do, we’ll go for 0.25 percent. We’ll try and get a quick hit with a couple of positions. Let’s take a quick look there.
So you can see you’ve got your profit display here. When I get to 0.25% profit, it will automatically close out my position. And I’m scaling in obviously fairly quickly here with the auto trades. So hopefully we’ll get a little bit of a push on this and you’ll see this automatically get out of the position with a quarter of a percent profit. So again for scalping, you need to be in and out pretty fast. There you go, so we’ve taken our second position, which is 50 points apart. When you get into these additional positions and price moves quickly in your direction your percentage gain will increase a lot faster and obviously if price pushes against you your drawdown will also increase a lot faster so you need to obviously be aware of that.
So what that will do that setting is automatically get you out of the position when the total of all of your positions equals a percentage profit target. Okay in this case it’s going against me so let’s scale into another one down here. Obviously I wouldn’t in when you’re scalping I wouldn’t normally say scale in to losers because obviously when you’re scalping tiny time frames you can have it pushing against you very very quickly especially when we have in things like war which are potentially happening at the moment. But we’ll see if we can get this one up to a profit target. I’ll just add into positions, probably add into another one when we get down to here. If we get down there, we’ll see how that goes. So that’s your exit strategies. There is another exit strategy called close trade on reversal candle. Now what this does is when price is moving in your direction, it will put a trailing stop underneath the low of the last bull candle or bear candle depending on the direction of your trade.
I won’t turn it on now because it will get us out of those positions. But what it does is when we have price, let’s take this as an example here, let’s say we took a short trade here. What it will do is when price moves in our favor, it will automatically put an invisible stop loss at the high of that last down candle. And as price pushes down, it will trail that invisible stop behind that down candle. And again, it would move it to there, it would then move it to there, it would move it to there, there, there, and then we had an up candle. So what it will do now is it will use that as the last stop loss. And when price breaks back above that level, it will get you out of the position.
So what it’s designed to do is when you get a nice strong trending move like this, it will automatically get you out when there’s signs of bullishness. So here you would have got out of that trade because that down candle would have had the stop placed on it and it would have placed it there. So actually that would have been your exit on this position. And the same obviously if price pushes up in your way, it trails the stop underneath the bull candles. So in this case, your stop would have been trailed up to there and you would have got out there. So it’s when price breaks below the low of the last bull candle or above the high of the last bear candle, depending on whether you’re taking a long or a short trade.
I’m just going to quickly add another buy down here to bring the average down, see if we get a push up and try and get that to close out automatically for us. So those are your exit strategies. You don’t have to use either of those obviously, but it’s handy if obviously you’re taking trades on maybe a slightly higher time frame and you need to step away for a minute, you can have it to automatically quickly open the settings and get it to automatically get you out if price suddenly turns in a way against your direction. Trailing stops we have also available. So you can use trailing stops, pretty self-explanatory. If you set that to true and price moves in your direction, it will automatically trail the stops for you.
It will have a trailing stop distance in points. Typically you would normally set that to whatever your stop loss is, and then a trailing stop start. And that is the level at which price has to move in your favor for it to start trailing your stop. So when price moves 200 points in my favor in this case it will start to trail my stop up for me. Okay and if price pushes down obviously it will stay where it is. So it drags your trailing stop after a set number of points by a set number of points.
You can also have this trail on candle close, not on tick. So for example here, it would only have trailed the stop when you get a close of the candle, which means that any wicks that you get won’t necessarily take you out. So this is actually my preferred way of trailing stop, which is why that is set to true as default. So I’m looking for price to actually close and then I will adjust my stop based on where that candle closed, which means if you get a big wick down and then a push up, that big push up will not drag your stop up.
It won’t actually move your stop until the candle closes. But you can play with these in the strategy test and see how they work anyway. Same with all of these settings. Trail stop below candles instead of points. If you set this to true, as price moves in your direction, it will automatically trail your stop at the low of X number of candles. So here, for example, if we got in with a cell there and we had it set to two, it would be there. And as price moved down, it would just drag your stop loss two candles behind as price moved down and it would stop you out. Okay. This is something that somebody that I’ve asked for it isn’t something I particularly use and the reason I don’t like using that is because It quite often gets you stopped out very quickly and because what you will find is you will get a wick That will actually end as a candle in your direction But the wick will take you out because you’ll trailed your stop too tight behind price so personally my preference would be to use this trailing stop on close of a candle and use distance in points.
But there is an option there as I know some people like to trail behind candles. And again if you want a big trailing stop you can set that to maybe five candles and obviously we’ll keep dragging that trailing stop a further distance. Draw sessions and opening ranges. So the EA is set to automatically draw in opening ranges and this is a strategy that I use and many traders use at the open which is the opening range breakout strategy so what we have is two sessions we have the Frankfurt open and the New York open and you can set the times of the Frankfurt open and the New York open which will be based on your broker so from my broker the Frankfurt open is at, sorry not UK time, that is your broker time.
So 10am broker time is the Frankfurt Open and 4.30 broker time is the New York Open. And what it will do is it will automatically draw in lines for you. Let me come out to a bigger time frame so we can see them. It will automatically draw in these lines for you at the open. So that is the Frankfurt open there and that is the New York open there. So when you set the EA initially it will automatically draw in those lines for you. Let’s go down to a lower time frame. See if we can get that trade closed out, 0.25% profit. So the opening ranges, it will automatically get drawn in for you at a set time. Okay, so what the EA will do, and I’ll show you this in the strategy tester in a second, we’ll do some more work in the strategy tester, is it will draw a horizontal line on the chart at the close from the open to the close of that particular candle. So in this case, I’m looking to have the five minute opening range drawn on my chart and the 90 minute opening range drawn on my chart.
And there’s reasons for these. And for the New York Open I want the five minute opening range and the 90 minute opening range. So you can select two different opening ranges and you can also draw those in on your chart or not have them drawn in on your chart. Okay, so you can set those to false if you don’t want this feature to be used. You have an end of trading day as well which you need to set for the end of your trading day via your broker and this will vary on each individual instrument. So most Forex pairs will tend to close at 11.59 broker time. Things like indices will have different closing times.
So something like 10.15 may be the close of the DAX for your broker. So you would need to set this depending on what your broker is and you can easily see that by looking at this dotted line. If you haven’t got that dotted line that is your period separators. So if you zoom into your chart on the DAX so that is the 1055 actually but it’s that is what I would put in as my close basically end of trading day for the DAX and obviously for FX and other things you’ll have different ones there so you would alter that dependent on what you’re going to use and there’s two reasons that’s used. First reason is the opening range lines of New York will get drawn to the end of trading day which is what’s set there. The Frankfurt opening range will get drawn to the New York open and we’ll see this on the strategy tester in a minute when we have a look at it. So the idea behind these settings is that you will do what’s called an opening range breakout.
So let me just quickly, I’m just going to add another buy there, just going to see if we can get this actually to close out automatically for us. We’ll quickly go to the strategy tester and we will do a quick opening range on the five minute chart. Actually, let’s do the one minute chart for the DAX. I don’t know how much data I’ve got in here. Let’s just go from the 1st of February. I should have enough data in there up to today. We’ll start that. Okay, so it’s gonna start obviously moving through now.
We’re starting on the 23rd of February, which is yesterday. Wow there’s no data in here is there? Okay that’s not very helpful. No data right let me just load in some data on the sec. That’s not very useful. Okay let’s do five minute opening range, five minute chart that’s going to work just as well. So five minute chart we’re on now. I haven’t got enough data in there to draw the opening ranges in either. Right okay. This isn’t very useful. One second let me just change the dates.
I’m not quite sure why that’s not drawing the opening ranges in there. I had this problem on this Roboforex broker for some reason I had this problem the other day it decided it didn’t want to draw in the opening ranges and it was something to do with the data in there. It worked on all other platforms but not on Robo Forex for some reason. So I can’t show you that feature but if you go and put it in the strategy test it hopefully it will work for you. I haven’t got it in my other account let me just one second let me just see if I can get this in my other MT4 that I’ve got another one set up here for Axie which should hopefully have more data in it. Let’s try that in the strategy tester. There we go.
Okay, so I don’t know why, but Robo Forex, for some reason, doesn’t want to draw properly. But anyway, we can see there, the opening ranges have been drawn, okay? So this is for Frankfurt, the purple line. So there you have your opening range low and your opening range high, and that is the first five minute candle. And then at 90 minutes, it draws in the opening range high and opening range low, which is that candle there, and obviously where we actually open is the opening range high.
So it draws in those opening ranges for you automatically. I’m just speed this up and it will do the same thing in New York. There we go, so there’s your New York five minute opening range high. So it’s that candle there. And then if we go forwards, it will draw in the opening range low which is the 90 minute low and that’s where that drew that in there okay and again the high was the same in Frankfurt so the idea behind the opening range high and the opening range low if we do this on one minute it will become more clear okay is that you take an opening range break on a particular time.
Now I use the five minute on the one minute chart. So what we’re looking for is a break of this opening range. So quite often we will go into an accumulation after the open when the initial volume comes in on this works on most indices, the DAX, the S&P, the NASDAQ. And then you’re looking for a break of that to enter into a trade and normally what happens is when we do get that break Of range we get a continuation push. So if we just move forward a little bit in time There we go. We saw we had the big break there and then price will continue down from there and Same thing for a 90 minute opening range This works better in New York, but there’s your 5 minute opening range break there, and obviously there’s a continuation. So the idea is when you get the 5 minute opening range break, that is the direction for the start of the session, and you can scalp that for however many pips, points, percent, or whatever you want to get.
Typically you would put your stop at the opening range high and the EA will auto trade this for you if you want it to which I’ll talk about in a second. That will basically obviously take the trades and then put the stop there and trade for you. So there’s that one there. Sorry I just lost my track on what I was actually going to say. Oh yeah it’s 90 minute, let’s just start another one, 5 minutes. What you quite often find with the 90 minute opening range is by the time you get the 90 minute opening range put in, you’ve usually found the high or the low of the day.
So if we see the opening range high there, okay, opening range high 2 of the 90 minutes into the session, that is the high. And you find vast majority of the time price will not return to that level as it did here. So there’s your opening range low of the 90 minutes for Frankfurt and there’s New York started to kick in. And you can see in each session what tends to happen is when you get your opening range high of 90 minutes put in, price very rarely will break that level after 90 minutes into the session. Again, there, 90 minutes into the session, we didn’t touch it again. Same here, opening range low, we pushed away. Opening range high of New York, we pushed away. And you very rarely will ever get back to that level.
So the reason the opening range high 2 is important is it tends to give you the direction for the rest of the day and the rest of the day will either be a trend day or a rotational day or an accumulation day. So that is what those ranges are there for. You can adjust these ranges to be whatever you want. Personally I use the 5 minute and the 90 because they give me a clue as to where we’re likely to go for the day and this is particularly true of indices. Never tested it on Forex. Typically I scalp on indices. So, but that’s basically the idea behind those.
And obviously if you want to change those at any time, you can do, let me just quickly whiz back and see what happens on that trade. The DAX, there we go. So on that DAX trade, it automatically got us out with half a percent profit on those five positions it took. And so it took half a percent, a quarter of a percent profit we had it set to, didn’t we? Yeah. So that’s that auto exit strategy that I was looking at previously. Another thing to just show you while we’re in here as well, it will automatically comment on why you got into the trade. So for example, I took an initial market buy, and then the EA auto added for me, and then I took another market buy, the EA auto added for me, I took another market buy, and then there was a market buy that hit its stop loss, which it got me out of.
So the reason for your trade is also in there. Very, very handy if you ever want to export your history and then analyze it because what it will do is it will show you the comments for each of your trades and then you will be able to see all the time when I take a pending sell order, they tend to be losers and it will help you analyze how good you are with each individual type of entry that you take. Okay, so that was the draw sessions opening and opening ranges, okay? So those are those settings there. Draw recent ranges. What this will do is it will draw what it says, the last five candle range, the last 15, the last 30 and the last 60 candle ranges.
So if I turn those on for you now, let’s just use for the moment, let’s use the last five and say the last 30. Okay, what you will see it do is automatically draw in on the chart levels. Okay, so this here and there will be a line there is the last five candle high and the last five candle low and this is the last 30 candle high and the last 30 candle low which is the same. Okay, so it goes back 30 candles and it goes back five candles. These will dynamically adjust. The idea behind these lines is to help you trade range breakouts, which we’ve got right now. So you see a range breakout, you hit the buy button and you get into a position.
And I think I’ve got auto scaling in turned on very aggressively, so it’s probably going to get me into another one in a sec. But range breakouts basically are accumulations. So this is actually quite nice to demonstrate in the strategy tester as well because you can see them working more effectively in there. Let me just show you those settings in the strategy tester. So we use the five and let’s just use the 15 for the minute. So what you’ll see this do is it will and obviously this is 15 candles not 15 minutes so if you you can adjust these the reason I’ve chosen 5, 15, 30 and 60 is because most people tend to trade and scalp on the 5 minute or the 1 minute charts therefore it’s given you the option for the last 5, 15, 30 and 60 minute range on a one minute chart.
But you can use it on any time frame. So you can see we’ve got the lines drawn in here. We’ve got the red line and the green line which signify the high and the low. And as we go through those lines will automatically redraw. And the idea being here, this is a bit quick, what you’re looking for is exactly what we’ve got here, a contraction in price. You can see the lines are very, very narrow and close together. So what this is indicating is that we’ve had a movement and we’re now in an accumulation. Accumulations form before the next breakout in either direction. So when we see those lines gradually getting closer and closer and closer together, when we get a break of them it’s usually an indication that we’ve accumulated and this is now the next move in our chosen direction. So whichever way this breaks out will likely be a momentum move for X number of candles in this case up So there was the range and you see it’s popped up there. Whoops. Just move that back down again and And that’s what those are for so you can adjust those and fine-tune them if you want to use range breakouts And they’re really really good to use in conjunction with what you can see on the chart here, which is the candlestick pattern identification.
So when you get a bullish engulfing or a strong closed candle that breaks out of a range like that one there, that will be an indication that obviously price is potentially going to move strongly in one direction or the other. So there for example you would have had a five minute range drawn, you got a strong closed candle which broke out of that range, we went into accumulation and started to drop. So that is your trade entry, the strong close out of the five minute range or five candle range or whatever this one is in this case. This is 15 candles, I think, depending on the time frame of your trading. So it’s configurable to do whatever you want. And again, it’s there as an option if you want to trade range breaks.
So, where are we now? Recent ranges we’ve got covered, we’ve drawn those in. Candlestick patterns, okay, so these are candlestick, this is a candlestick pattern recognition system basically. What happens with candlestick pattern recognition is it will only kick in from your first session open. So the Frankfurt session open I have at 10 o’clock, which is 8 a.m. UK time. Most brokers use UTC plus two. So UTC is eight o’clock in the UK is UK time. So most brokers you will find will be using 10 o’clock candle for Frankfurt open and 4.30 candle, which is 2.30 for the New York open in America.
So what happens is with this candlestick recognition, it will only draw these in from that open. So if you want to, you can adjust that to be the start of your broker’s day and it will start drawing those candlestick patterns in from them obviously. But you would normally only really use price action during high volatility times which is usually at the open and the first sort of hour of the day and then we go into a range or contraction a lot of the time and then again for the next open of New York. So price action candlesticks you could use an EMA filter as well for these so typically a lot of people me included will use two moving averages on their chart when they are scalping. I tend to use And I use EMAs as most people do. EMAs are better to use for short time frames because they are just based on the most recent price action, their exponential moving average, rather than simple.
So they adjust based on the ATR as well, on the actual movement that you’re getting. So they’re a little bit more accurate. Let me just change that one to red so we can distinguish between the two. So there’s my 20, there’s my 50. So if I set my filter here for candlestick patterns to true, which is as default, and I use the 50 EMA, it will only show me candlestick patterns, which are bullish when we are above the 50, okay? So it’s only gonna show me bullish candlestick patterns. So it won’t show me a bearish strong close, which we’re potentially getting now, because we’re above the 50. So idea being is you want to be trading with the trend when you’re scalping or you’re trading low time frames so you would use either the 50 or the 20. In fact I’ve got those the wrong way around I think.
Yeah that’s the 20 I’ve made red. So this just for me I use green and red for the 50. So the 50 is the one that’s in use at the moment. So you would only want to trade short obviously if we are below either the 20 or the 50 depending on what you want. You could use the 200 as well if you wanted to or any EMA that you like. But idea being is I only want to see candlestick patterns against me. Now you may not want to have that set on because you might want to see candlestick patterns that are against you because those are potentially exit signals. When we get long wet candles and strong closes in the opposite direction to what we’re trading, it’s a sign of strength coming through and we may want to exit our positions. So you can have that set to true or false. If you turn it off, it will show you every single one. Just to quickly run through what the candlestick patterns are. You may or may not be familiar with them but a strong close candle is a candle that closes very close to its high. Okay so for in a bullish strong close and it will put the sc underneath that candle. So this candle pushed up and the close of the candle was very close to the high of the candle.
Okay and you have a have settings here that you can alter with these. So your strong close candle minimum in points will be the total size of your candle and the strong close wick maximum length as a percentage of the candle will be what’s left at the top. So if you were to set that to 50 for example that wick at the top of the candle could be Halfway through the candle the idea of a strong close though is we want to close as close to the top of that candle as possible So 20% of the candle is really what I found to be the optimal on that one the candle length Will vary depending on what you are trading. So this is to do with the amount of points that a particular instrument will move in one candle. Now obviously if you’re going to go on to bigger timeframes your candles are going to move more points. On tiny timeframes they’re not going to move an awful lot. So in this case on the DAX the candle there which was a strong close was 299 points. If I move over onto the New Zealand dollar yen and measure that candle that was only 43 points so that wouldn’t give you a signal if you had that set to less than 20. So as default, so less than 40 rather, so as default I’ve set them fairly small but you may want to adjust these so that it only shows you really decent sized candles because strong closed candles we are looking for really to be propulsion candles i.e. an accumulation and a break out of accumulation which tends to end in a pull back and push.
So that is a strong closed candle out of an accumulation and again if you had your range bars drawn in there you would have seen that range break and then retest the range and off we go. Again that was counter trend so you probably wouldn’t have taken that one, but that’s what that basically does. Two inside bar signals. So an inside bar signal, these are a little bit rarer, but what an inside bar signal is, is a push in one direction, and then, so this would be a green candle, and then a pullback into that candle, and it has to close inside the previous candle. So that is a initial propulsion move. Typically a strong closed candle has to be a strong closed candle and then a pullback inside. So inside of that bar, this is where we get the two inside bar name from and then a push back up in the direction of your initial move. So this is the second inside bar. Typically when you get a push and a pullback and then a push, it tends to be followed by a continuation move. So this is a very fast move like that where what we’re seeing is big price movement coming in, a pullback from the sellers and then buyers stepping in and rejecting those sellers absorbing them and pushing forwards. So the two inside bar pattern is a really nice strong pattern a lot of the times. And again you can fine tune that to say what size your initial body has to be of that first candle. So typically you would want it to be a big bodied strong candle, strong closed candle. Okay so if you the smaller you set that the bigger these wicks are potentially going to be and the smaller the candles will be.
So they tend to work best with large bodies and this these settings that I’ve got here are all kind of slightly fine tuned for the DAX but they will work on most indices as well but again you can adjust these as you see fit. Long wick signals pretty straightforward long wick is like that shooting star hammer type setup where we have a long wick on the candle and again you can alter the settings on this one. So the tail length as a percentage of the candle. So obviously here. We’ve got the body there and that is the wick. That is more than 50 percent of the entire candle height. So that is that setting there.
And then the long wick candle size. So that is the entire size of the candle. And the reason that setting is there is to stop you getting signals on tiny little spinning tops like that. Now you may want to have them on tiny little spinning tops like that, which is fine. So you would just set your minimum candle length to be small. But what I’m looking for when I’m looking for these sort of candlestick patterns is a strong move in one direction, followed by a long wick to the downside and kind of a hammer or a long move to the upside and a shooting star. So that is a price action indication of the end of the move and the seller stepping in and absorbing the buyers positions ready for a move in the opposite direction. The other thing to note about this candlestick pattern in particular is it needs to be the high of the last five candles as well.
So you can see this one here that will have signaled short if you weren’t using a moving average filter because it’s pushed up by five candles and this is the new high of the last five candles. The reason that is in place is to stop you getting signals like that. Okay, so these are useless long wick candles because they are in an accumulation. If they do not make a new high or a new low of the last five candles, it will not give you a signal because any long wick candles which are in accumulation are just indecision. Long wick candles at the end of a strong move are signs of absorption and reversal. So there are rules applied to there as well. Equal highs and equal lows, very, very self-explanatory.
When we get an equal high or an equal low, it will automatically signal. signal let’s look at this in the strategy test and we’ll find some let’s see if we’ve got one in here so still running and I said it running again on let’s try on one minute we’ll probably find some so you can see again here it didn’t draw any candlestick patterns in because the Frankfurt open hadn’t started now it starts to draw because we’re at the open now we’re looking for price action at the open. Let’s see if I can find one. There’s one. There’s a couple in there.
So there’s an equal high. Okay, so that one is an equal high because it’s matched that high there. There’s an equal high there that’s matched that high there. The way the equal high and equal low pattern works, the recognition system or the logic behind the pattern is, it will look at the current candle’s high and then it will look back five bars and see if it can find an equal high. If it can, it will signal if it can’t it will look back another five bars and then another five bars So it’ll go 15 bars back. So what we’re looking for is a recent equal high in this case you can see obviously the high put in there was equal to that high there and Basically, that is a sign of rejection. So we pushed up rejected. We’ve tried to push up again. We haven’t we’ve rejected again, we’ve pushed up and we’ve had another rejection.
After that equal high you tend to get a strong push and again we’re scalping, we’re looking for very, very small profits in out done by the end of that candle. Could have gone out at the end of that candle. That equal high you wouldn’t really have taken because it’s not really any kind of signal is it, we’re coming out of an accumulation. But that’s the logic behind the equal highs, there’s more in there that I found, there’s an equal high there, there were a couple others I spotted, there’s an equal high there, so that one is an equal high of that candle there, so again we had a move start off of that so it’s just rejection, but again with equal highs and lows ideally you would see them come off of a level and put in that nice M formation, which is why it looks back total of 15 bars. Okay.
So that’s equal highs and equal lows. The other candlestick pattern we have is the good old bullish and bearish engulfing. So minimum body size is the only setting you have for that. The bullish and bearish engulfing are pretty straightforward. The candle has to completely engulf the body of the previous candle. So we had a strong closed candle down, which was followed by a candle in the opposite direction, which was much larger than the previous candle. That is a bullish engulfing, typically a sign of the buyers or the sellers starting to take control or continuing control. So got a bullish engulfing there.
And again, this is a tiny little bullish engulfing. This is not optimized for this particular, this is for the S&P. So you would probably want to have that being way more. So probably something along the lines of 300, maybe for the S&P. So what you would do is say the minimum body size of the bullish engulfing has got to be 300 points. So you can fine tune these for each individual currency pair.
The only way you’re really gonna know that is by measuring and having a look at each currency pair. See we’ve got 28 points on the New Zealand dollar yen. So the setting for the S&P is going to be completely different. That’s all for the candlestick patterns. Now we’ve got auto trading. Something you need to use in a tester before you use this in live testing. Auto trading is there to automatically get you in to positions based on the criteria that you set.
Now there’s different settings for this and this is why you see some of these saying buttons and auto because they apply to both of them. So fixed lots instead of percentage, this only applies to auto trades and will not be used in normal button operation when you’re hitting these buttons on a live chart. You can select to use a fixed lot size when you get into trades automatically. Okay, and so it’s automatically defaulted to 0.01. So if we stick this in the strategy tester and ask it to do auto trades, see how I’ve got this set up, let me just reset it to defaults. If I want it to take the Frankfurt initial opening range breakout for me, it will take that trade and it will base it on the risk that I have set, so half a percent in this case. So we’ll just let this run and we’ll show you how this one works. So the Frankfurt opening ranges.
We’ll take a trade. When we break the low of the five minutes, which was there. This one didn’t work. So it took that close there because we broke below the low on that strong close candle. The stop is always put at the opposite range high, okay? So you can see the lot size it would have got in on that one would have been fairly big because it was a very very tight range 483. So if we look at the result of that trade it took a point two. Okay.
If we change that to use fixed lots it will automatically get us in with a 0.01 regardless of where the stop loss is placed. So it will take the same trade But in this case it will have just used a point naught one okay, so you can use fix lots on it if you want to as opposed to a Percentage risk now you can see in this case. Obviously. We’ve got the opening range break Very very quick Now the this one works as well on candle close rather than just on breaking that line So the actual entry on this one would have been somewhere down there if it hadn’t have broken there. It will only take one trade at a time. So if we break the opening range low, it will take a short for you. The opening range high is still alive.
So if this was to push up and then break the opening range high, it would take a trade opening range high for you and the stop would be put there. The idea being is we quite often, as in this case, we get a false breakout. Unfortunately, we got stopped out on this one, but this was an incredibly tight range on this particular day. So if we break back above that level, which it’s not going to do, it would take another trade there. I’m not sure we haven’t got it set up to take the New York opening range breaks. So again you’ve got individuals for New York opening range. Now opening range breakouts you would typically take the Frankfurt opening range breakouts on things like the DAX or the FTSE.
You would take New York opening range breakouts on the Dow, the S&P or the NASDAQ. But you do get volatility across all indices at all breakouts. So if you look at the S&P here at the Frankfurt Open, we didn’t get an awful lot of volatility. We didn’t get much volatility at the Frankfurt Open on the S&P. We got some, but not a massive amount, a tight range. When you move to the New York opening range, that tends to be, in this case it was obviously quite a day, but it tends to be bigger. You get more movement on the American indices during the American session and on the European indices during the European session. So what I would do is I would set this up on the DAX and say take the Frankfurt opening range. I would set it up on the Dow or the NASDAQ or the S&P and I would say to take the New York ranges and not the Frankfurt ones. And obviously you can trade opening range breakouts on the second opening range as well. In this case, it’s at the one and a half hour point.
But if you wanted to take a 15 minute opening range and a five minute opening range break, you could quite easily do that by setting it to 1645. And then it will draw in the opening range. And let’s do it on that one as well. 10, 15. So it will draw in your opening ranges and take opening ranges. I have no idea if these will work. We will be on New York, won’t we? Let’s go to New York.
So, it will take those breakouts on those two for you depending on what you’ve set your times to. So, there we go. You see that obviously these are very close together because we’ve said show me the five minute and the 15 minute opening range. It hasn’t moved anything much more in 15 minutes than it did in five, but you’ll see probably on New York we’ll get different lines drawn in. There we go. So we took the five minute opening range break on that candle there, yeah, and we took profit down there, and we’ve got a sell on the 15 minute opening range taken there with our TP down there.
Let’s see if that one plays out as well. That one didn’t play out, that one stopped out. I know it hasn’t stopped out because it’s the opening range high. Because it’s the opening range high two and opening range low two, that particular trade. There we go, and that one TPEd as well. So both of those worked that day. So that’s basically those settings there. So that’s auto trading with fixed lots and auto trading the opening range breakouts.
And I say you can set two of those a day for, you can actually set four. If you wanted to trade four different opening ranges on the Frankfurt, what you would do is you would set all these New York ones to also be Frankfurt and you could set one, two, three, four different opening ranges, but you can set these. I’ve called them Frankfurt and New York because obviously it’s designed to trade off of specific sessions and opens, but if you decided actually now, I only want to trade the Frankfurt open, but I want four opening ranges drawn, then you would just set those two to be Frankfurt and you would change this to also be 10. I’m not sure why you’d do that, but anyway. So that’s the opening range breakouts. Auto trading SC patterns, very straightforward. When we get a strong close, it will automatically take a trade for you and that trade will be based on the settings that you have set.
It will either be trading stop loss fixed or it will be using ATR to get into your positions. So these will work on auto trading. Two inside bar patterns, long wick patterns equals and Bullish engulfing okay now I have not done any testing in detail on This as a completely automated system. It’s not what it’s for I built this for buttons to get me in and out of Trades very quickly adding to my positions and get me out of positions when I want to This will automatically get you in on all of these now if you select every single one of these obviously it’s going to take an awful lot of trades. Now the way that auto trading works on these patterns I will show you in the tester is and I’ll do this on a 15 minute chart just to so we can slow it down a little bit and demonstrate it. It will take a trade only when the high or the low of the candle is pierced.
So it will not use market orders to get you into these positions. Best practice when you see a candlestick pattern is to place a pending order above or below that pattern. So I’m just going to quickly show you in here. So I haven’t got anything being drawn here at the minute. So let’s say for example I wanted to get in on this bullish candle here. Best practice is not to get in immediately, it is to set a pending order and this is why we have these buttons above the high of that candle because what you will find sometimes will happen in this case is a prime example. Big strong closed candle, yeah, immediately set a pending order above that candle.
What happened? Price pulled back straight away and went into a two inside bar pattern. So we haven’t triggered that trade. Now you see this candle come down. This may have been a bearish engulfing in the opposite direction, which would have been an instant loss or instant drawdown or instant stop out for you. By placing your pending order above the high of the candle, you’re only getting triggered when this candlestick pattern is being confirmed, i.e. we are definitely still moving up, and it will grab you and take you along the way as momentum pushes in your direction. So as we’ve got a strong close going in here, I would be saying, right, let’s get me into this trade.
I’m going to put a stop under the low of the last candle and hit me if we get in above the high of that candle. This obviously turned off at the minute. So that is basically where it replaced my pending order. So that’s what happens with the automated trading as well. So if we just get to a point on the 15 minute chart where we can see it starting to take some trades. Let’s see if we can get one. There. So we got a pending order there.
I’ve got a very small profit target, obviously, set up on this. So we had that strong close. Yep, and you see it placed a pending order at the low of that candle. That pending order triggered when, not on that candle, but on the candle where price pushed through and broke that low, and then we TPE’d there. So I think we’ve got a quarter of a percent target set up on this as an auto exit.
So it got out very, very, very quickly on the trade. And obviously this is scalping, but this is on M15. So a little bit conservative for an M15 chart. But that’s basically how it works with all candlestick patterns. So a strong close candle on the open of the next candle, it will place your pending order at the low of that strong close, and it will not trigger until price has pushed through. And we’ve got a confirmation So if price pushes back against you you would then normally in if you were trading menu You’d hit the cancel button saying that don’t like it The EA does the same thing if price pushes back in the opposite direction It will cancel that pending order for you, and it will cancel it After a certain amount of minutes, okay, and it’s set as default to 30 minutes. It will automatically cancel off pending orders.
This is 30 minutes or five minutes or whatever it is from the opening candle after the pattern is formed. So it’s from there onwards, okay. So set that to whatever you want, but basically it’s there as a, if I get a pattern and it goes like that, then just get rid of that order because what we don’t want is to leave it in the market and then tomorrow, price does that and then that and grabs us when we don’t wanna be getting in.
So it’s designed just to cancel those orders off automatically for you. We’ll see if we can see it doing that. It’s probably just gonna get into all of these. See if we can see it cancel an order off. Triggering them all and taking profit on them all, that’s a problem. Yeah there you go, so there’s one that’s cancelled. So we had an order entered there and then because we, I’m not quite sure what the candlestick pattern was there, but we had an order entered there and on that long wick and it was cancelled off 30 minutes later. It was on a 15 minute chart.
So that’s basically what it would do. That long wick I wanted to get in short, price pushed against me so it said no trade, cancel the order. So that’s automatic and that’s based off of that setting there. So you can also trade individual patterns. If you love trading bullish engulfing, bearish engulfings, just use that. If you like trading hammers and shooting stars, just use that or use bullish engulfing. Use any combination you like of these and obviously set up the candlestick patterns for whichever you want.
You have to have drawing turned on for the pattern for auto trading to work. It says that requires drawing of each. If I just move that across, you’ll be able to hear what it says, of each to be turned on. Okay, so you’ve got to have the drawing on because the EA auto trading only works if the pattern is drawn on the chart. Last thing you’ve got down here, obviously this magic number will be up at the top in your miscellaneous settings on your version. This is development version I’ve got Stop trading at daily target auto trading only if you set that to true For your auto trading it will get you out and stop trading when you hit a daily target So this is really handy to use if you wanted to use auto trading for price action and You wanted to watch what was going on have the EA automatically get you in and you be sitting here on these buttons, if it got to a point where it got into one beautiful trade, and I’ve had this happen to me many, many times, we’ve got a lovely bullish engulfing, I had it set to scale in three or four times, and it basically went up to there, hit target and banked 2.5% on that one trade, what I will have it do is automatically stop trading for me at my target. So if you wanted to just make 1% a day, 20% a month using this, you would say right if you make 1% on your first trade today at the Frankfurt Open, I’m done. That’s it. I’m happy. And it won’t trade anymore for trade any more for you. So I would encourage this to be used if you’re using auto trading because one of the biggest problems people have, me included in this, is over trading.
You have a great day, you have three or four trades at the open where they just go your direction, you bank three or four percent and you’re like today’s going to be an awesome day. What you end up doing is giving back that three or four percent and then losing one or two percent and that sends you full tilt and you go crazy and start over leveraging. This is designed to stop that happening. If you want to make one percent a day and you’re happy to make one percent a day, this EA will keep trading and taking opportunities for you all day long until that target is hit. And if you’re going to have a day where it’s going to be a down day, you’re going to have a down day.
But if you get that target hit, it will stop the trading for you. So we can see, probably see that in action. I’m not sure the best way to set this up. I want to get it in and out fast. So let’s get it to scale in super quick on the S&P. Let’s go 50. And we will ask it, I’m going to turn the buttons off in here as well. We’ll ask it just to get us in on everything just get us in every time you see something bullish or bearish and we’ll use the 20 as a filter and we’ll use 0.5 fixed.
Okay so let’s see if I’ve got exit strategies. So I’m going to target 0.25% profit on each of my trades. Let’s see what this does. I have no idea what this is going to do, but I just want to try and demonstrate the point of it stopping trading when you bank some cash. Okay, so we’ve done some trades there. They were losers. I’ve no idea whether these settings are good, bad or indifferent. It seems to have stopped trading. I’ve probably got this set actually way too tight.
It’s probably actually not going to be able to make profit because the settings are too tight. But obviously you can play around with these settings. We take an opening range breaks as well. I think I’ve got my stops way too tight on this. an opportunity to work out. But anyway that’s what it does. It looks like it has maybe stopped trading. I can’t see if there’s any candlestick patterns coming in. Yeah so we stopped trading basically. There was no nothing being drawn, no auto trading happening because we’d obviously hit the 1% target for that day. So that’s basically what that setting does. So it only applies to auto trading.
It won’t apply to your buttons. If you want to carry on taking trades on buttons, it will do. I’ve got a trade running at the moment by the looks of things. No, I haven’t got buy stops. So, yeah, so that’s an overview of all the settings, everything that it does. At present this is obviously version 1. I will probably adapt it and add to it or change things depending on feedback but that’s the overview of the settings and how it’s designed to be used. So from a strategy perspective when I’m taking my trades I will get into positions when I get candlestick patterns basically so when we get a strong closed candle I will take a long and obviously scale into that long until I see some signs of bearishness and then I will get out of those positions.
I’ve just taken a trade there for no reason whatsoever obviously because there’s no pattern, but just to demonstrate a point. And then what I will tend to do is obviously monitor how the trade is going. And the idea being is I’ve got into a position. Let me just cancel that one. I’ve got it wrong. I will get into a position and I will say I want to put a buy stop above that candle as well. So I’ve got in long. If we break high, I’m going to get into another position there. And then it’s also going to auto scale in for me.
So if this position goes my way, brilliant, I’m going to make some money. If it starts to go against me and looks like it’s coming down, then I will quickly get out of it, usually before it hits my stop loss. So if that’s looking bearish like it is at the minute, I’ll probably say get out of it, don’t like it. And then obviously if price moves against me, no problem. I’ve basically reduced my loss by getting out quickly and that’s the whole point of these buttons. But you can trade it, trade with the EA, a lot of the time what I do is I look for trend pullbacks. So, here for example, when we pulled back into the 50 and got a nice long white candle, I would go in short but I would set a pending order under that low there.
Yeah, when I saw that candle close and when I got gathered up on it, add into the position and then get out somewhere down there, quick in and out with a tight stop That’s the idea behind it if you want to get leave your trades to breathe a lot longer You can obviously have much wider stops and not use candle stops. You can use Pippa mount stops so if this is pushing down hard and again, you could use an RSI or something if you wanted to but From the moving average point of view when we get pullbacks into moving averages and we start to get bearish price action that typically is the direction you want to be trading. So I would get in with sales and then if price pushes up against me I could say get in with a sell stop and add to the position bring my average up and then hopefully get that move down. If it pushes against me after I’ve taken another position close out the position get out quick. So best practice is always, if possible, to use buy stops and sell stops rather than market orders whenever you’re trading, whenever you’re scalping, really.
But any time frame, you know, if you’re thinking, right, I want to take a long here, don’t go long here. Go long there. Yeah. So go buy stop last. OK. Or buy stop this candle. Yeah. So if this now continues to push down against me, I’m not in a trade. I’m not going to make a loss. If you hit that button now and this thing pushes down against you, you’re immediately going to go into drawdown. But what I’m asking for by using these pending orders, and these are the buttons I use all the time, the buy stop last and the buy stop, if you see from me, reversion trading is I’m trying to get in when price is pushing up I will put pending orders underneath the lows of the candles yeah and then as soon as we get down there I would have triggered into that trade these would have never have got triggered so I would cancel off those pendings that trade I got into and then price starts to move in my direction stop above the high pushes up bearish may have taken in another trade may not have pushed down into another position out or cancelling it as it pushes up.
Up to you. But by using these pending orders what you’re going to find is that you will not get into so many trades and get stopped out so quickly. Because now this buy stop is sitting there. I’m not in that position yet. Now I am because we’ve got bullish price action. Obviously bear in mind I’m trading the one minute chart so this is just chop I’m trading at the minute. Normally I would be on M5 most of the time. But as you can see I’ve got into an initial position after that strong push down so I’m expecting to mean revert back to the moving average.
I got into another position because it broke above that high and now I’ve got an average here so I can hover over the close button. If this pushes down and looks bearish and gets down to something like that I can get out really, really quick. If it continues going in my way, it’s going to get me into another buy, which it just has there. My average is now moving up and it only entered there because it pushed above the high of that candle. So I’m looking for these highs to get invalidated, to get into positions long. And that’s basically the way to trade.
113, and there’s stop loss. What’s that from? Because I’ve probably, I think I’ve got other trades on. Anyway, let me just close all those out and close all those pendants. So yeah, so those are the ones that you would be better off using. Now, if you’re thinking it’s going to go short now because we’ve pulled back to the moving average and we’re going to continue on our bear run today, you would go, right, have a sell stop under that last candle. So if we now get bearish price action, i.e. a rejection of the 20 moving average, get me in when we start moving in that direction. Don’t get in just because we’ve hit the moving average. Get in when price is confirmed, yes, we are actually going to go down, those pending stops. Now if price pushes up with me up to the 50, what I would do is I would cancel that.
We’ll see what happens with this candlestick. So if this turns out to be an inside bar and we push higher, I will cancel that pending order off and then place a new pending order under the low of that candle that is just been painted as bullish. And I would just basically be trailing my stop up. So if you think as price moves up, you’re just trailing your order up under price waiting for that reversion to happen. When that reversion happens, you usually get a follow through of a couple of candles, and that’s where you’re out. And that’s why these buttons are much more used personally by me than those, because I’m getting in when price is confirmed.
See at the moment I’m not in that order, because the pending order goes below the low of that candle. We didn’t do it, did we? We got an inside bar, and price is pushing up. So I’m not gonna get in, because price is not going in the direction I want it to at the moment. It’s a good chance we may push up and retest the 50 or possibly with 200 I’d imagine or 100 there in this particular case.
So right now I can cancel that pending order and go with a self-stop underneath this candle yeah and it’s placed it 20 points below the low of this candle which is what we got set in here. So, I’m sitting waiting for price to make up its mind. Now, if it goes into an accumulation here, I’ll just sit there and wait for it to accumulate. It can do what it likes. When it breaks, we get a strong close in one direction, then I’m going to get gathered along the way. If this turns into one of those massive big candles, out straight away. Or add to the position and hold it. Obviously, it’s entirely up to you. Okay, so that’s it for the settings and basically how I trade with it. I mean, typically I’m on M5 and I’m playing these pullbacks to moving averages. Yeah, in expected direction. This is the DAX I traded this morning. Didn’t work.
I was trying to get the gap fill. I didn’t quite get it, unfortunately. Right, so open to questions now for anybody that’s got them. I’ll go through your comments. Breakeven stop is spread and commissions. Note, breakeven is breakeven at entry. It doesn’t take into account your commissions or your spreads. It’s just moving your stop to breakeven basically. If you adjust the settings once the trade is opened, will it work or is it only for new trades like if you add or change the trailing stop method? So if you open up the EA and enter any changes in here, that’s no problem at all. Basically, the magic number is what is being used. trades I’ve taken here and I hover over these, you see that it says placed by expert ID 100. So the EA knows that this was an order that was placed by the EA. And it will monitor and manage anything it’s got the magic number on. So you can come in here and you can make as many changes as you like. As long as you don’t change this magic number, it will manage the positions on here. If you enter manual trades, i.e. if you go up here and press buy That is not going to be taken by the EA it says placed manually, okay It will not manage this trade. This is nothing to do with the EA you will have to manage this manually But why would you ever use those buttons? You got buttons here use those These are faster execution automatically calculate your lot size and you can adjust them on the fly Which is exactly why I built the thing because this is something that is sadly unlacking in mt4 and mt5 There is no fast order execution system. I want to get out close it bang done. That’s what it’s for So yeah, it will only and it will obviously manage them so if you come in here and say I Didn’t have had to I didn’t have scaling in on, for example, and I’ve taken a position, I’ve taken two manual positions with the buy buttons here, and now I actually think this is going my way.
I want to scale into this automatically. So you can come in here and say, yes, please, scale me in automatically, and what it will do is it will then start scaling in for you, because it’s managing your positions taken by the EA. So you can make as many adjustments as you like in here. You can say, right, this looks to be going my way. Every time I get a pullback and we get a bullish engulfing in line with the 20 moving average, please get me in automatically. And it will do that for you. So you can make adjustments as you’re using it.
Obviously, if you open a new pair and you want to start trading Cajen for example and put the EA on to Cajen You need to give this a new magic number So that it can now distinguish Any trades taken on here as being taken by expert ID 200. This will manage all trades with a magic number of 200 and adds to all trades with a magic number of 200. On your other chart it will be trading with 100. one is 200 that one is 100 yeah. Turn off auto scroll it will keep you from going back too far yeah okay that was to do with the strategy testing. Five minute and 90 minute work also for forward exchange and gold I don’t know test it. You do get movement on FX. Yeah, so let’s test it. Let’s go into FX and pick an FX pair. Let’s just pick Pound US Dollar and we’ll look at what happens to the Pound US Dollar at the Frankfurt Open. Just reset it. So there’s your Frankfurt Open. Yeah, there’s your movement.
There’s your New York open, there’s your movement. So I don’t know, you’ll need to test this. But I built this for indices scalping. Indices in my opinion are the best thing to scalp and there’s two reasons for that. First you have typically a strong directional bias for the day. Indices will tend to go into either rotation day or a trend day. When you get that opening range of five minutes and opening range of 90 minutes broken, you tend to get a continuation on indices. And it happened obviously on the pound US dollar here as well. So they’re much easier to trade.
And you have a time where you know they’re going to come alive. Indices come alive. The DAX comes alive at Frankfurt Open at 8 in the morning. It does this and then it goes bang. Same with the FTSE. The S&P, the Dow and the NASDAQ at the New York Open go crazy. You can see that if you’ve been in the live rooms, which most of you have, you can see that happening over and over again. If we have a look at the DAX this morning, yeah, so this was pre-market, this was the open, bang, look at that massive propulsion candle and all of a sudden you’ve got loads and loads of volume coming in, yeah, and that doesn’t happen as much in FX pairs. The other reason it’s good to trade indices is first of all spread. Let me find a spread meter. I must have one in there somewhere. I’ve got more indicators than indicator shop. There we go, spread.
So I’ve got one point spread on the DAX. So if we go down to M1, put my ask line on. You can’t see it. You can’t see the spread. It’s that tight. If we look at the spread on something like the pound New Zealand, you’ve got six points, five or six point spreads. Much much much bigger. I’ve got the ask line set to none. There we go. So there’s your spread.
Yeah, you see how big that spread is? It’s huge. Look at the DAX. You can’t even see it. It’s that small, the spread. Yeah, virtually nothing. And that’s the same with all indices. So you’ll find you have very, very high spread. So if you want to scalp with this, obviously you can trade with this tool on any time frame. If you want to trade M15 super slow, do it.
No problem. Obviously then spread is much less important. M5 and M1 is typically where people tend to sit when they’re scalping, but M15 just as equally if you were taking pullbacks, you’ve got a lovely bearish engulfing there, which you would have got a BE signal on. You would have put a pending stop there, and you’d have been gathered up on it there and you’d still be in the thing. It’s never given you a reason to get out. We had two inside bars. Perfect inside bar there, look.
Two inside bar pattern. Push up, push down. Off of that inside bar, break, down. Perfect. So, yeah, if you want higher timeframes, obviously, price action at higher timeframes is going to be much, much, much better. Much less opportunities, much slower. People scalping want to be in and out and done in a session. My goal is at the open, I want to trade the opening range break and I want to trade the initial 15 to 30 minutes of the open and I want to hit my target and go, that’s it, I’m done for the day.
That’s why we trade small timeframes and that’s why this is here so that we can try and get are 1% or whatever it is very, very, very quickly. So yeah, that’s why I would use indices rather than FX, but yes, you can. You can trade it. 590-minute work on forex and gold. You have just covered that one. If trades close in profit already, just like now, where we can see how much we’ve banked so far in percent. You can’t. You would look in your P&L down here.
So there’s no targets as such. I mean you’ll keep a manual track of it really. There’s no display for what you’ve banked with the EA because you could be trading with other EAs, you could be trading manually. So it just keeps track of your current trade. The idea being again, I keep coming back to this, the reason this whole thing triggers at the open of Frankfurt, we don’t see any candlestick patterns before then, is most traders will start trading at the Frankfurt open because this is when it comes alive. You should be able to get your target hit at Frankfurt open or within a couple of trades of the Frankfurt Open. If you have a bad day and you go down, then yeah, you go on to trade the New York Open.
Or if you’re in New York, you won’t even see the Frankfurt Open. You’ll just trade the New York Open. Yeah, just closed, save that. So yeah, it doesn’t keep a track of ongoing statistics. Again, anything you’d like to see, put it in the Telegram group, and obviously we can adapt and evolve the EA as we go. So you see obviously when I hit the close trade buttons there, it hasn’t closed this trade out because this trade was taken manually, it wasn’t taken by the EA. So I’ve got to close that one out myself. So the auto trade and scalping features would be more suitable to be used on indices or they can be used on fx pairs too. Just covered that. Please do one back test on any 4x pair m5 or m15. So let’s see. I’ve just kind of done that haven’t I in here. It’s kind of running now so I’m not quite sure what you want to see in here. But you can see this is not drawing candlestick patterns.
The reason being is, I guess, we’ve got this set. Let’s see what we’ve got this set to do. Let’s just reset all this to defaults. So we may need to change the size of these candlesticks, so let’s go with just put everything down to fives So this is on m15 So there’s your strong closes, okay now obviously right so this is something that we may need to adjust. The offset of this is done on points and this works perfectly on indices. This might be why some people have said they’re not seeing the candlestick patterns drawn. You are, it’s just they’re painted a long way away. So I might have to put an offset in there because this is set to offset of about 45 yeah 45 pips which on an indice is absolutely fine on 4x. That’s why you’re not seeing the candlestick patterns because they’re being drawn off the chart. Okay, I will get that fixed. I’ll make a note of that and I’ll roll that out as an update today. So the offset basically is something that needs to be tweaked. But yeah, so it works fine. Obviously candlestick patterns will be drawn as normal.
Obviously you need to tweak the settings for the individual pair you’re on based on how much the candles tend to move in the settings. But you’ll probably find actually those are okay settings. Might need to be tweaked for the pound US, you’re not really getting many signals off of that. And something that’s really useful to do with this from a strategy testing perspective is to run this in the strategy tester for a long period of time and see all those opening ranges drawn in and see what happens after those opening ranges and see what sort of price movement you get because you’ll find those opening ranges, especially the one and a half hour opening ranges for the session, tends to be the higher the day or the lower the day already put in.
So those are good ones to go and back test and just visually look at. I didn’t cover back testing in the EA either, did I? So let’s quickly do that. Set that to true. Stop loss 400 that probably want to be something like a hundred two hundred maybe for the pound US dollar. Okay so I’ve asked it to turn the buttons on. Okay so now in here I can just buy, close, sell stop, sell again, modify my TPs, modify my stop losses, close. Yeah, so you can use this for trading in here. Obviously the trouble with this is the speed of the tester is notoriously super, super fast or snail and there’s no real this scale should be slow to fast not fast and not as fast and these don’t really do anything not great but the point is you can trade in here and what you would probably want to do is have it set on 31 because what you’re seeing here is 15 minutes playing out probably in about 20 seconds so you can get a lot of price action practicing.
Yeah, hit a cell there. Move your TPS and stop losses. The TPS and stop losses are way too big on this. I’ve got it set to like hundreds. It should be much, much less. But for example, let’s not use Pippermint. Let’s use the last candle. So let’s put a cell stop here and stop above the last candle. Obviously, I’ve got an offset of 10. So I’ve got the offset set way too high again.
So you would want to go in here and change the offsets for the pending orders and all that sort of stuff. So you need to do all of that as well. But play around. But you can practice in here. And this is one of the other great things about this is you can come in here and you can practice your scalping, your trading, your pullbacks, RSI extensions. So if you want to just trade when you get RSI extensions and go for longs when you see bullish engulfing candles like that, do it. That’s the open, take it.
So you can practice all your strategies in here and say, I don’t like the look of this, it’s going up, get out. Play with it. So the auto trading scalping just covered that one. When I use a buy stop or a sell stop, the TP normally is 2 to 1 or can be a reversal candle. So when you use a buy stop or a sell stop and you want to use 2 to 1, you very, very simply, let me just get rid of that, is that. That’s 2 to 1. that’s two to one. So if I sell now, I’ve got a two to one risk reward. I’ve got a 400 point stop and 800 TP. That’s two to one. Three to one.
That’s three to one. And that’s the other nice thing about this. If your outlook on the trade that you’ve taken changes and you think actually I don’t think we’re going to break below that low so I don’t think we’re going to get more than 400 out of this change it go for that low and then say right actually I really don’t like the look of this one I’m just going to reduce my risk on it because I don’t fancy it do it and that’s the beauty of these buttons is you can adjust on the fly if you take a trade and you suddenly go, actually, no, that doesn’t look right. Change it. And you do it very, very quickly. Obviously, you can drag and drop. You can, you know, you can do all of this like that once you’ve taken a trade. But if you’ve taken multiple positions because you’ve got a scale in set, you can’t adjust all of these very, very quickly.
Whereas if this suddenly puts in a whacking great bear candle down to there now, I’m going to hit that button and go, no, no, no, no, no, don’t get me out. And I’ve done this multiple times. You get news come out, especially at the moment with what’s happening in Ukraine. You get news come out and you’re short and all of a sudden you get a whacking great bear candle and you go one and a half percent into profit. There’s a good chance that’s going to push, isn’t it? Don’t get out at your initial TP. Modify your TP and modify your stop. Drag your stops down and push your TPs away from you.
Let your winners run and scale into your winners and drag your stops down to protect your positions. So if you get one of these, here’s a prime example. You get in there on that entry, pending order under that low, you get in there and then the next candle is a whacking great one like that and you had a TP here, you go, no, no, no, this thing looks like it’s going. I’m going to move my TP down. So you just literally hit that button, adjust your TP down, and then hit your stops and modify your stops and pull your stops. So you’re basically bracketing price as it’s moving, pushing and pulling, you can push these buttons to basically modify your position in the market very, very quickly, which is what I do a lot of the time.
If something’s going my way and I think it looks really, really good, i.e. I’ve suddenly seen actually we’ve double bottomed balance, that looks even better than I thought, I might actually go for 800 on this one, I’ll do it. And I can do it that quick. And I might think, right, I’m well into profit on this, let’s get all of my additional positions added in with 1% risk, not half a percent risk. Let’s really scale into this one hard.
Obviously that will bring your average up quicker, but you can do it. And you haven’t got to think about, right, what lot size? I’ve gone in with 1.12, so if I put a stop there, how much is that gonna be? You don’t need to worry about it. Just hit that and it’s done. In, out.
Sorted. What’s the number of system that can use the product key? So this is exactly the same as anything on the marketplace. You get 10 activations, which is 10 PCs, or 10 VPSs. If you wanted to put the, I mean, I have not, and I will stress this, I have not gone into the strategy tester and asked this to auto-trade for me, optimized it, and tried to find a way to make this make money for me on autopilot yeah that’s not what it’s for and that’s not what I’m using it for the auto trading facility I’m pretty sure you’ll be able to find a successful strategy with this you will need to play around with your TPS your stop losses your targets your trails you’re scaling in your risk you’ll need to play around with lots of settings in the strategy tester and see if you can get every single strong close candle to scale in and exit at a percentage profit for you and then close everything out at a percentage profit a day and keep doing that.
I’m sure there is a setting and a set file out there to do it. I haven’t had time to look into it. But the way that I use this personally is to say, right, I want to get in on any bullish or bearish engulfings in line with this. Because what I see right now on my chart is today we are likely to have a strong trending down day. So the next bearish engulfing you find for me in line with the 50 moving average, get me in automatically. I haven’t got to worry about it. And if that bearish engulfing works and we push 200 pips in my direction, scale me in a couple of times.
And then I’ll be looking at this and suddenly go, oh wow, 10 minutes after it took the first trade, I’m sitting at 1.2%. I’ll have that. Close, yeah. So that’s what the auto trading is designed to do. It’s not designed to be one of the EAs where you will stick it on a VPS and just let the thing go. It may well work that way. And again, if we can find set files I will share them and everybody who’s got it if we find set files let’s share them and let’s back test them but the purpose of it is to use these buttons to get you in and out quickly in the market in the direction that we’re looking to go yeah so at the moment this is trending lovely between the 50 and the 20 so I’m more than happy to get in with a cell stop on any short So if we break down below the lower this candle get me in if we continue to push up I’ll keep Putting in cell stops and getting in Okay, so that’s it That’s all the settings done. Anybody got any other questions? You’ve asked questions Which I’ve answered so hopefully I’ve answered all those questions if you have any more questions come into the telegram group Telegram group I will stick a quick link in The chat now, so if you can see the chat on this replay because this is a live replay There’s a link just gone in the chat now to the telegram group coming the telegram group ask questions if there’s features that you would Like to see changed features that you think could be improved or added let me know and obviously I’m happy to develop it but this does everything that I need it to do right now and it works for me and if it doesn’t work for you obviously we can adjust and add as necessary but obviously you can go and get this on the MQL5 marketplace now and I’m writing up the manual, the full manual for it, which will be published possibly today, if not tomorrow.
Okay. So yeah, hopefully that was useful. I think I’ve covered everything I needed to cover in there and I will get that offset for the signals adjusted and I’ll get a release pushed out for that. So obviously when you’re using FX pairs with it, you’re getting those signals drawn closer to the candles. I’ll decide whether or not to use… I might use an ATR offset actually because an ATR offset is automatically going to position these based on movement and candlestick size, so that will auto adjust for everything then won’t it?
But I’ll think about that and get that mulled out as a release. Just close that out. Okay, so that’s it. Hope you enjoyed this. If you want the EA, obviously it’s on the Marketplace and it’s the Price Action Toolkit. You can just go and search in the Marketplace on MQL5. Again, if you’ve got any questions, come and meet me in the Telegram group. And yeah, hopefully you enjoy using it and it does everything you want it to do.
And let me know if there’s any changes. Have a good day. does everything you want it to do and let me know if there’s any changes. Have a good day.




