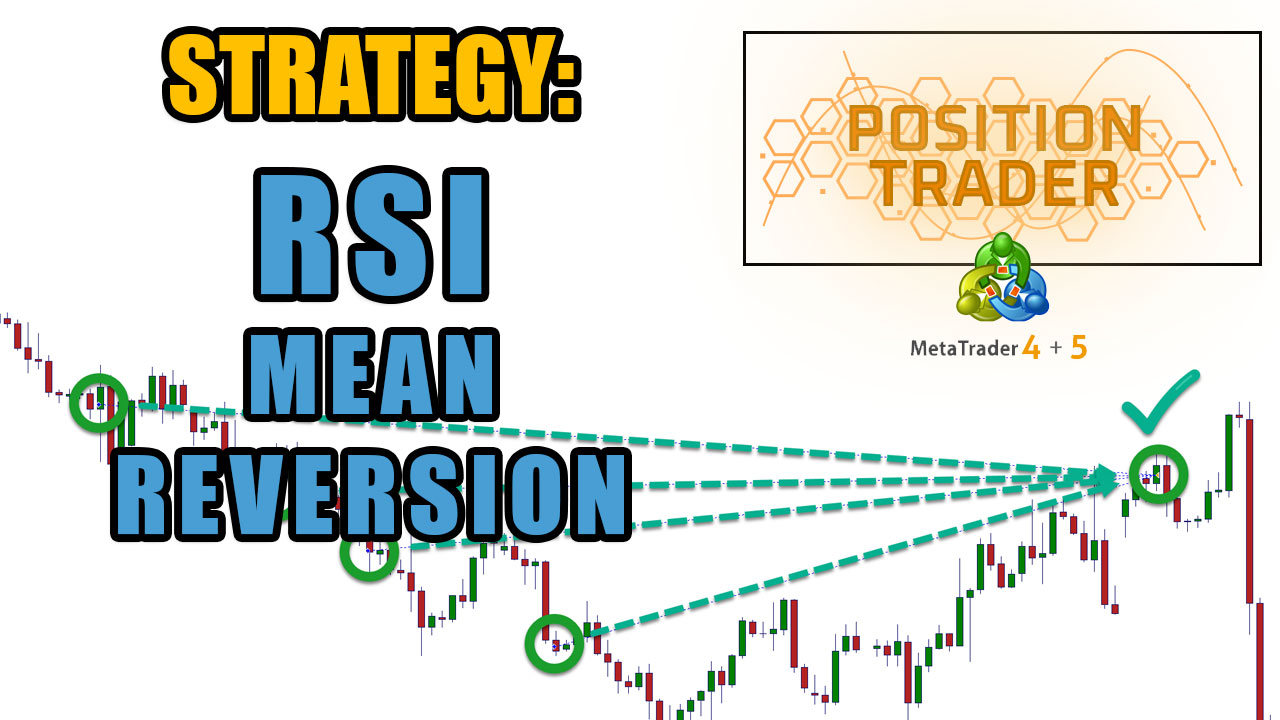
The trend pullback strategy is a multi-timeframe strategy that uses a higher timeframe in two ways. Firstly for trend direction analysis and secondly for exhaustion in the opposite direction of the main trend.
The strategy uses the daily time frame to find trend direction. This is done by using the 72 EMA on the daily, which is a reliable trend indicator of intermediate trend as it represents around 3 months of market movement. When price is above or below this EMA, we look for positions only that fall in line with that trend.
Once we know the trend direction, we next we look at the H4 chart to find points of exhaustion using the RSI, but we are only interested in exhaustion levels in line with the trend.
i.e. if the market is trending down as in the image above, we are only interested in taking trades when the H4 RSI is extended at high levels (above 70 or 80) as this indicates a pullback in the current trend may be happening.
When the H4 RSI is extended, we then look to take entries on the lower timeframe on M15 when the market reversal alert indicator shows us a sign of weakness and potential reversal move happening. This means we are entering trades in line with the overall market trend when a pullback is due according to the intermediate timeframe RSI (H4) and getting in at what is potentially the start of the continuation move of the trend on M15.

To trade this strategy manually, you can use the Market Reversal Alerts Indicator and a standard RSI and moving average.
To trade this strategy automatically, you can purchase the Market Reversal Alerts EA for MT4 on the marketplace.
Market Reversal Alerts EA Results For 1 Year with 99.9% accuracy tick data trading the M15 time frame using this strategy.
Set file available in this blog post on the MQL5 website.