
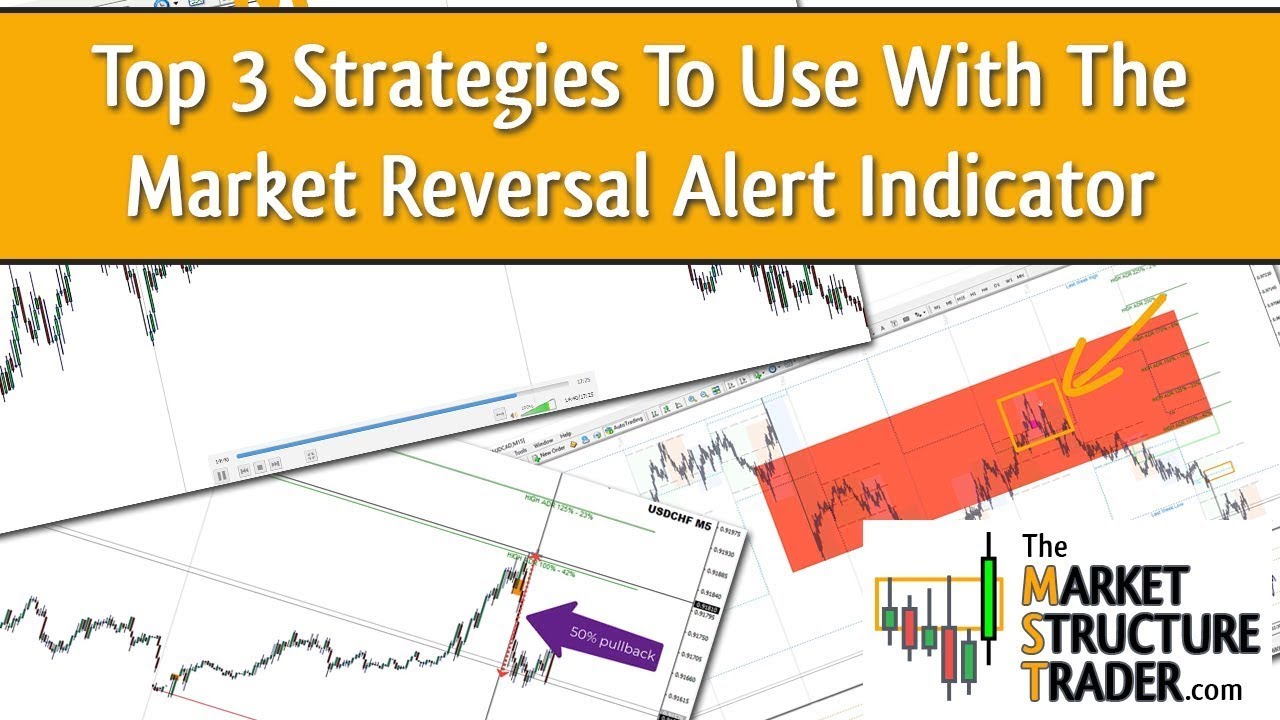
The market reversal alerts indicator is incredibly powerful and fits perfectly with virtually any system to enhance and confirm entries into any market. These are the top 3 ways I use the indicator to find high probability setups on multiple time frames.
You can download the market structure reversal indicator here: https://www.mql5.com/en/market/product/46295
Download the dashboard to alert to all time frames and pairs here: https://www.mql5.com/en/market/product/62751/
NOTE: DOES NOT REQUIRE THE INDICATOR ABOVE TO POWER IT!
Here is the ADR Reversal Alert Indicator: https://www.mql5.com/en/market/product/62757
And it’s dashboard too: https://www.mql5.com/en/market/product/62756
Video Transcript
In this video I’m going to go through the top three strategies to use with Market Reversal Alerts Indicator and those strategies are going to be the multi-time frame bias pullback, the ADR reversal pullback and the double top and double bottom reversal. So as with all strategies, as you’ll know if you’ve watched the other videos on YouTube and on the website, you need to have confluence of conditions coming together or confluence of indicators to make sure that a strategy or a trading system has a higher probability of success. So with these strategies we’re going to be looking at today these ones all have confluence of multiple levels or multiple indicators to make sure that they are sort of robust strategies and we’ll work across all time frames and all different instruments including metals you can use this with crypto with forex with indices whatever you trade basically these strategies should work well. Okay so let’s look at the first one multi-time frame bias pullbacks. Now this is the traditional strategy that I started using with the indicator years ago and this is basically a multi-time frame system.
So we’re using a higher time frame for a directional bias and we’re using a lower time frame to take our trade entries. Now there’s a video on the website which you may have seen which is called using multi-time frame analysis for direction and trade entries and that basically goes over the best time frames to trade with multi-time frame analysis. So we’ll quickly recap those now. These are basically the M5 and H1, M15 and H4, H1 and Daily, and H4 and Weekly. So whichever time frame you choose will basically be based on how often you can trade and how often you can be in front of your charts. So for people that work all day long, you’re not going to be able to look at M5 charts regularly. You’re going to need to be going up to higher time frames like the 4 hour and the hourly for your entries. So you need to just pick two time frames that work well together with you and these will be the ones that we will use within your strategy. Now the typical one that a lot of people tend to use is M15 and H4 but you can use any combination you like.
There’s some people using the indicator to scalp on the M1 chart and they’re using M30 and hourly as their directional bias indicators. So you can use any combination of timeframes that you like, but make sure that the timeframes are far enough apart so that one of them is giving you a longer term directional bias and the other one is giving you entry signals. If you pick two timeframes which are close together like M5 and M15, you’re basically trading pretty much the same price patterns. So you need a bit of distance between the timeframes and I’d recommend usually looking somewhere around about 15 or more candles in between each time frame. So for example on the hourly time frame as an entry time frame you would use the daily for trend direction because there’s 24 hourly candles in one daily candle.
Okay so let’s look at the strategy. So the basis of the strategy is that you use the higher time frame to enter trades only in the direction of the higher time frame bias. So in this instance here we’re going to take a look at M15 and H4 as an example. So as you can see here we’ve got the M15 chart. So we’re going to concentrate on this reversal alert that we received here. So you can see that we had a reversal alert here and then we had a retest alert shortly after it. So this particular trade was a short trade and as you can see it worked out very nicely and it’s still playing out now. Now the reason this trade would have been taken is because the H4 directional bias was telling us to go short. So if we turn on the H4 reversal bias here we’ll see that the indicator is telling us that the market is currently bearish because the last reversal alert received on the higher time frame in this case h4 was a bearish reversal and as you can see the indicator has painted that reversal onto the chart for us also.
Now with this strategy you can continue to take short trades on this particular pair until the higher time frame bias switches to bullish and then you would just do the reverse and start taking long reversal alerts on the m15 time frame in the upward direction. Okay so we’re looking for bearish signals on the lower time frame now because we are bearish on the four hour time frame and when that switches to bullish we’ll look for bullish reversal alert signals to start kicking in to give us some trades to the upside. Now the best quality trades to take as you can see here are trades where we’ve just had a reversal alert trigger on the four hourly chart so if we switch up to four hourly and zoom in we can see that this is the reversal alert on the 4-hour chart and as you can see as with most reversal alerts what tends to happen is as soon as price has given us the alert it tends to often pull back into the area of the alert and then continue in its current direction.
So this particular zone here which is drawn on the chart. That is the area where we want to ideally look for our initial trade entries. So if we switch down to M15 again, you can see this area here where this alert was given was within the higher time frame reversal alert rectangle. So this is the perfect trade entry for the multi-time frame bias pullback system. So you can take trades as many times as you like in direction of that trend, but these particular trades where we are initially pulling back into the initial H4, in this case, reversal alert, are the highest probability trades that you’ll be able to get with the indicator. So what we’re doing here is essentially we’re trading the retests of the initial market structure break on the higher timeframe. Okay.
So that is the multi-timeframe bias pullback strategy. And to add additional confluence as with any strategy, what you want to do ideally is have an extended condition on your confirmation indicator. In this case, I’m using the relative strength index indicator. So when we get this reversal alert on M15, and we have our peak put in before the alert triggers, I ideally want to see the RSI being extended above the higher levels to tell us that it’s a really good opportunity for taking a short. So 68 or 80 anywhere above those levels would be a perfect confluence level for the indicator. Okay so that is your multi-time frame bias pullback strategy. The ADR reversal pullback strategy is a very very simple strategy and it basically praise on the fact that price will only move a certain distance the majority of the time in any given day. So this works with all currency pairs, indices, metals it also works in crypto although crypto can obviously be a lot more volatile but basically price will have an average daily range and the normal average daily range used by most people is somewhere around the ADR 10 or the ADR 14 and basically what it’s doing is it’s given us a measurement of the average daily range of that particular instrument over the last 10 days and what we can extrapolate from that information is a percentage of the number of times where price has extended beyond those levels. So this as you can see on the screen here, is the ADR reversal indicator.
And what it shows you is the average daily range of any particular instrument that you load it onto at 100%, and then extensions above those levels up to 225%. And it also shows you the percentage chance of price extending beyond those levels when it gets to them. So as you can see here, when price gets to 100% of its average daily range, and we’re using the average daily range 10 figure in this case here, there is a 42% chance that price will go higher than that, which means that 58% of the time, price will stay within its average daily range.
When price gets to 125% of its average daily range, there is a 23% chance of it going higher so you can see that the odds of a reversal starting to happen or a pullback happening when we get to these levels increases the further price digs into its average daily range for that particular currency. So as you can see here we’ve got an example on the screen of the US dollar swiss if we zoom in and you can see here today that price pushed up into the 100% ADR level and immediately pulled back and then it gave us our reversal alert. Now the best time frame to trade these setups on is on M5 because you’re going to get your market reverse alerts coming in quicker than on time frames like M15. So this is a day trading or intraday strategy and the idea of it is that when we get our market reversal alerts once price has hit ADR or is extended above ADR we’re looking for usually somewhere between a 25 to a 50% pullback and as you can see it’s hit 26 27 pips so far today. Now that 50% is calculated on the ADR figure of the pair or the instrument that you are trading in this case the ADR 10 figure is roughly 50 so we’d be looking for at most really a 25 pip reversal move or pullback move on that particular currency. Again like any other system the ideal would be to have an extended condition on your confirmation indicator and again I’m using the RSI here so what this is telling us is that price has been pushing hard to get to ADR today and there’s a high probability of a reversal coming in. You can also use additional confluence of levels so if price has recently pushed up higher than a previous area it’s likely that they are taking out the stops of everybody that took a short position there therefore there’s a much higher probability of this being a decent pullback. You could also use Fibonacci to measure the distance of the move and if you want to use your Fibonacci retracements you can use those as well to calculate how far back you think price is going to go but typically I find somewhere between a 25 to a 50 percent retracement of the high of the day or the low of the day if it’s hit the ADR low and it’s typically the the best target to go for with these particular trades.
Now, if you like to trade basket or grid trading strategies as well, where you enter multiple positions on a particular trade, you can do this very easily with the ADR reversal indicator or with this particular strategy, because you can see that when price gets to these levels you could place pending orders at each of the corresponding levels above the 100% ADR and as price pushes up, you can get into multiple trades and then take the short as the reversal starts to kick in. Or if you get up to ADR 100, for example, and you get a reversal and then price pushes against you, which it will do on some occasions, you can wait for the next reversal and then take a second position.
And if it continues further, you can wait for the next reversal alert and take a third position and then as price pulls back down you can scale out of all three of those positions for an overall profit on the trade. So there’s lots of ways you can use the ADR reversal pullbacks strategy with the indicator but obviously the most common is literally just to take the initial reversal alert you after prices hit the ADR stop goes above the high and then set your TP at roughly 25 to 50 percent of the ADR level ensuring you’ve obviously got a positive risk reward ratio on that trade. The double top and the double bottom reversals are basically the traditional M and W kind of formations that you tend to see formed when price turns at a high or a low. As you can see on the chart here we’ve got the Aussie dollar CAD four hourly chart up and you can see here clearly there is a kind of double top formed well this is more like a triple top but basically price has pushed up to a high pulled back pushed up again and then pulled back back and continued on its current direction.
If we switch down to the M15 timeframe, you can see again at the top here, we have another double top formed, although this is what I would class as an uneven double top or an uneven M pattern in this case. And basically it’s the same thing where price is pushed up to a high, it pulls back, and then it comes and retests the previous area, and it can either push up a little bit higher or it can hit a double top to the pit or it can push up and then pull back without actually reaching the top again but it’s the same pattern and you can see down the bottom here we have a kind of potential double bottom forming also and this is basically where price has pulled down hard pushed up pulled back and now it’s starting to look like it may be pushing higher again.
So when we get a reversal alert from the indicator, I like to see this kind of double top or M or W pattern, if it’s a low put into the market, which gives us confidence that this is price retesting that area, trying to break through for a second time, but failing. So these tend to be the stronger type of signals that you will get from the indicator. And again with any strategy that you’re looking at you need to have confluence within that strategy. So again here we can see on M15 we have the relative strength index indicator and as we got up to the highs here price pushed up above the extended levels on the RSI and showed us that it’s a good potential turning point for price because it’s had a strong push and is due to have a pullback. You can also use levels obviously as another confluence to take your trades. So we’ve flicked over to the hourly chart here and as you can see for example on this particular entry here when we got the market reversal alert signal the price had come down and touched this area of support which was a previous area of resistance pushed up pulled back and then given us another reversal alert to the upside. So this in itself is a double bottom forming isn’t it so we’ve got a W pattern forming there and it is also at a level of previous support and resistance. So there’s lots of ways there that you can use the indicator to spot double top and double bottom reversals and again with any system confluence is key so we need to make sure that we have a coming together of multiple conditions of levels or confirmation indicators or ideally both when we get our signals from the market reversal alert indicator to make sure that we have the highest probability setups that we’re taking.
to make sure that we have the highest probability setups that we’re taking.




