
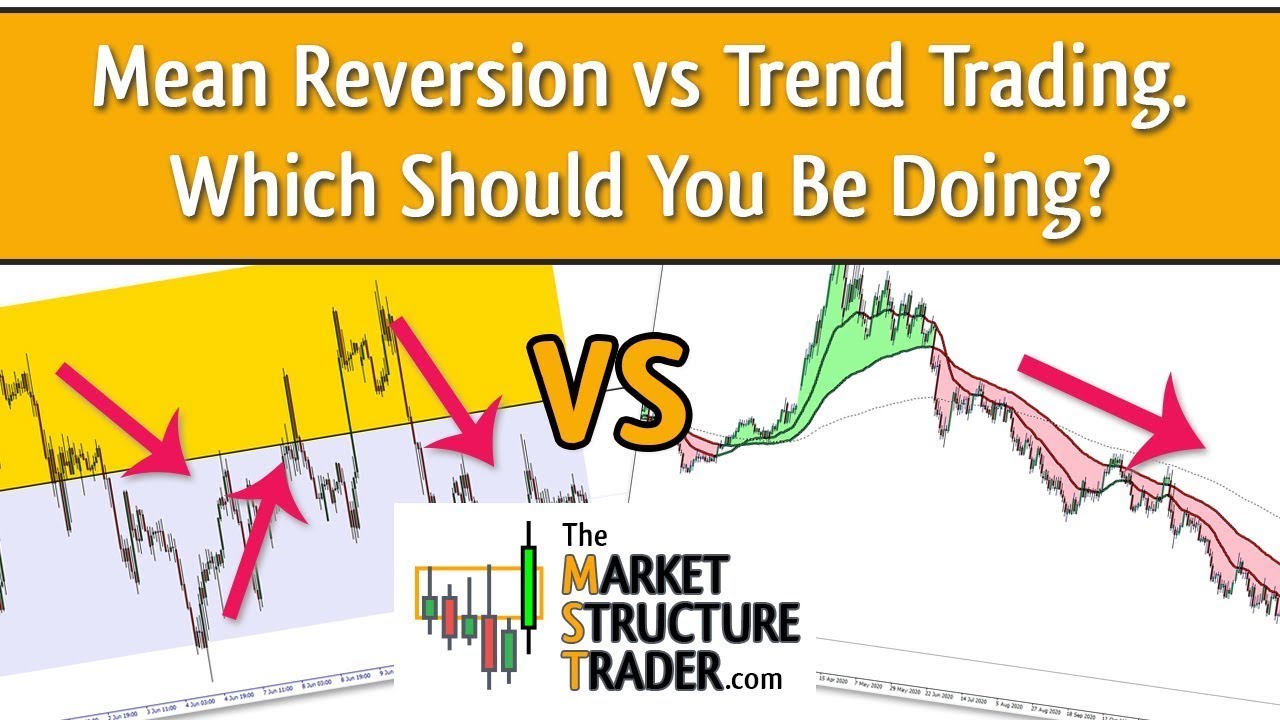
Ask yourself if you want to be right or profitable? The forex market and most markets in general spend around 80% of their time ranging and reverting to the mean average of price. If you are trying to catch that big trend, you are missing out on 80% of the trading opportunities out there!
You can download the market structure reversal indicator mentioned here: https://www.mql5.com/en/market/product/46295
The ADR Reversal indicator shown is available here: https://www.mql5.com/en/market/product/62757
The EA mentioned in the video is available here: https://www.mql5.com/en/market/product/65383
Video Transcript
So the reason I wanted to look at this subject today was mainly sort of brought about because a couple of people have contacted me about the EA and strategies that they’re using with the EA and looking for ways to improve them. With all EAs, everybody’s looking for the holy grail where you get an EA, it has a beautiful profit curve, you stick it on a chart, it sits there and trades, you go and sit on the beach and drink Mai Tai’s and make loads of money. Obviously that isn’t the real world. There aren’t EAs out there that do that. If there was, I’d have found them in 13 years and I would be sitting on a beach drinking a Mai Tai rather than talking to you and I’m not.
So the EA basically is designed to allow you to semi automate or mostly automate your strategies with the market reversal alerts indicator. So what I want to talk about today is mean reversion and trending strategies and the difference between them and the advantages and the disadvantages of mean reversion versus trending strategies. So there’s two main types of strategy that you can use, obviously mean reversion and trending. And I guess you guys probably know the difference between mean reversion and trending. It’s fairly easy to spot.
We’ll have a look at the US dollar CAD because that’s a really obvious one. So what’s the US dollar CAD doing at the moment? Anybody got any clues? As opposed to trending or mean reversion? Downtrend, yeah, correct. Okay, so you say that this is at a downtrend and I would tend to agree with you, but let’s flip down to H1 and have a look at what it’s really doing.
What is this actually doing? What’s it been doing for the last three, four weeks? Ranging, it’s consolidated. So the difference between mean reversion and trending is actually not a lot. When you’re in a trend, you can well be in a mean reversion state as well. So a mean reversion state is where you have price moving from an extreme. So let’s look at it from a range band perspective. So from an extreme to an extreme and reverting back to the middle. So what we call a consolidation or a range bound market is basically just mean reverting.
So the mean is the center line. Yeah, and you can have a mean reversion happening in a trending market where price is doing that. Yeah, so that’s a mean reversion. So the mean is the central line there and it’s trending down, but it’s still reverting to the mean. Same with Bollinger Bands. So Bollinger Bands move like that. Yeah, and they’ve got a central line, which is basically a moving average and what price does is it bounces around the Bollinger Bands reverting to the mean which is the center of the Bollinger Bands. So mean reversions happen in all market states so whether you’re consolidating or you’re ranging you will still be reverting to the mean and we can see the 24 moving average we’ve got on the daily here, we can see that as price pushes away down, it mean reverts back to the moving average.
And the moving average acts as the mean in this case. Yeah, so it pulls away, pulls back, pulls away, pulls back, pulls away, back, away, back, away, back. Yeah, so mean reversion happens all the time. Trending only happens around about 20% of the time. Yeah. So you’ve probably heard that, you know, people saying that in the past, you know, market spends 80% of its time in a range.
Yeah. Or in mean reversion of some kind and 20% of the time it spends in a trend. So as traders, what do you think is the best type of strategy for us to be trading? Trend trading or mean reversion? If we want to create an edge and give ourselves the best possible chance of being right, do you think we want to be trend traders or mean reversion traders?
It’s a difficult one because everybody tells you that the trend is your friend and stay in line with the trend. And that is true. I always like to stay in line with the 24 and the 72 from a trend basis on the daily chart. But my version of trading, the way that I trade, is I am a reversal trader or a pullback trader. So I’m actually a mean reversion trader. So what I’m waiting for is price to get extended beyond normal levels and then mean revert.
And whether it’s mean reverting back to a moving average or it’s mean reverting back to the center of a range, I don’t care. But what I want is price to be in a mean reversion state or in a trending state where it’s pulling back. Yeah. So basically, that’s kind of what mean reversion is. It’s just the fact or the description that we have for price moving in a choppy or a sawtooth, if you like, pattern. And whether that is happening sideways, or it’s happening in a trend, or it’s happening in a Bollinger Band, it doesn’t matter. As long as price mean reverts, we’ve got an 80% chance of being right. Yeah? So being a reversal trader or a pullback trader gives you a massive edge over being a trend trader. And the problem that I see all the time with traders, whether it be whatever strategy you use, it doesn’t matter what strategy they’re using or what strategy they’re building, is they get their TP wrong because they don’t know what type of strategy they’re trying to create.
So I’ll give you an example here on the US dollar cat, because we’ve got it on the screen and it’s So let’s say you had a strategy that said every time you get a candle that crosses two moving averages, you’re getting short, assuming that it’s going to go into a trend. Do you think you should be setting a massive TP and using a huge risk reward or a very small risk reward in that case? It’s not a trick question. You can use either really. But what you tend to find is the vast majority of people, if they’re building a trend-based strategy, will tend to go for the big risk rewards. So you see people entering trades with a five to one risk reward or a 10 to one risk reward. And what they’re doing is they’re trying to capture this big move.
So they put their stop here when they’re getting on this candle, and they will have, so that’s a one, maybe a two, three, four, five to one risk reward on that trade. Now, obviously, you’d have hit that, no problem. But look at how long it would have taken you, a year to hit that, if you’re trading on the daily charts, yeah? If I’m a mean reversion trader, and I’m going to take a one to one, or a 1.2 to one risk reward, a much smaller risk reward, on my mean reversion entry strategy, I could have got into this on that trade there.
So I could have got in with a one to one there. When it pulled back, it mean reverted. I could have got in again, little stop there and taken a one to one, pulled back. I put it, would have got in there, wouldn’t I? So wait for it to pull back. Would have got in again, maybe again there, wait for a one to one, pulled back, one to one, pulled back, one to one. I mean, I could have taken a three to one on that, couldn’t I?
But you see the difference between mean reversion and trending strategies. Trending strategy, you’re looking for the big, long home run. Mean reversion, you’re looking to be in, out, in, out, in, out as many times as you possibly can, regardless of which way the market’s going, because what you’re looking for is a very short, small risk reward. So a mean reversion strategy will typically have somewhere between a 1.2 to a 1.5 to one risk reward. And 80% of the time price is range bound or in a mean reversion state. So it gives us 80% opportunities to get into our market rather than that one signal we got waiting for that long trade to play out. Yeah, so you see the difference and when you’re creating a strategy or you’re looking at a strategy you need to know or you need to decide what type of strategy that is. Is it a trending strategy or is it a mean reversion strategy? And you need to adjust your stops and your TPs accordingly when you’re getting into those strategies or when you’re developing them. Because if you say, I’m going to have a mean reversion strategy, let’s look at this last bit here on the hourly. Let me just clean this chart up a little bit.
So we can see here, obviously, we’re range bound. So if we had a mean reversion strategy that literally just used the RSI for example. So let’s say our mean reversion strategy is RSI gets extended and I then look to take trades in the opposite direction. So we would have got in there and we would have taken a short. With a mean reversion strategy, we’re going to get in somewhere around here and we’re going to have a stop there and a TP somewhere around there, around the midline. So here is the top of our range, here’s the bottom of our range, and here is the mean of our range. So when we see price getting to these extremes, we want to be taking mean reversion strategies, you will find your strike rate on them will tend to be incredibly high. Usually somewhere in the 60 to 80% range for a mean reversion strategy is not unusual. But you’re only going to be looking for one or 1.2 or 1.5 to one risk reward. With a trend-based strategy, you’re going to get stopped out loads and loads and loads of times. So let’s say for example you went in short here with a trend based strategy, assuming that this is trending down, it’s pulling back and now it’s going to start a new trend. If you got in short here, put your stop there with a five to one risk reward, what would have happened? Nothing. Three weeks you’ve been in this trade, you haven’t made any money. With a mean reversion strategy, we’ve been in and out five, six, seven times, and we’ve been making money constantly, because 80% of the time it’s doing this, even when it’s doing that, yeah?
Let’s look at another area. Let’s take this area here, just because I can see it on the chart clearly, yeah? So that is March to April. So this goes down to the hourly. Yeah, so this is in a trend, remember? We’re in a trend on the US dollar CAD. See if we can find it, yeah. So even within this trend, what we did was got stuck in a range, sideways.
So as mean reversion traders, we would have seen it pull back and we would have gone and taken a short somewhere down to around there. When it got down to here we would have taken a long up to there because we know that even in a trend price is going to stop and it’s going to stall and it’s going to spend 80% of the time it does that it’s going to spend 80% of it doing that. Yeah, we are capturing all the money in these bits while everybody is waiting to capture that. So 80% of the time we’re doing this while we’re doing that for that big 20% of the time. If you look at other pairs out there, yeah, what’s this doing?
It’s just one massive range, isn’t it? Yeah, it’s mean reverting constantly. It’s not trending. So on the daily chart, if it’s not trending on the daily chart, how many more mean reversion strategy options are you gonna have in there for that period of what? A month? It’s sideways for a month. So depending what timeframe you’re looking at, you’re gonna have completely different opportunities.
So this is why mean reversion strategies are usually the most successful when you’re trying to pass things like prop firm evaluations. So with a prop firm evaluation, you’ve got a set amount of time that you have got to prove yourself. And do you want to get into a trend-based strategy where you might have to wait, and even on lower timeframes, you might have to wait three or four weeks for that trend to actually start, and then three or four weeks for that trend to play out, just to get one good five-to-one trade and three losers?
Or would you rather go into some kind of mean reversion strategy where you’re gonna be in and out the market multiple times on a weekly basis and making constant money with a higher strike rate, but only taking a tiny little bit of profit out of them after each time. Yeah. So that’s the difference between the two. And the main difference you will find between those strategies is one of them will have a big risk reward and one of them will have a very small risk reward.
Yeah. Peter just said, performing your wick off. I just seen your comment, Peter. Yeah. So on the US dollar CAD. Yeah, that’s probably when I said, what’s it doing now? It is performing a wick off. You’re quite right. So, they’ve got the spring there. Yeah.
So this is forming a very nice wick off. So that should do that. Potentially, but the fact of the matter is, before it did that, we would have been making money going up and down and up and down like that. So you’ve just got to find the right type of entry criteria or entry method. And obviously when you’re looking at lower timeframes and you’re looking for mean reversion options, we are basically trading market structure aren’t we? So you can see that price pushes up and then it will make a new high, another new high, another new high and then it will start to make a lower high and market structure starts and this is what the reversal alerts indicator is telling you is potentially this is where we’re going to turn. So if you just take those entries and take small profits, you’re gonna be right an awful lot of the time.
And obviously if you basket trade in the way that I basket trade by getting in multiple times, if I’m wrong on one entry, I will just use the next potential turning point to get another entry to bring my average to the right position, but I will still target the mean. So let’s say for example, I got in here. I was expecting that to be the low, that’s the high, and there’s the mean in the middle. Say I got in there and I was aiming to target there and I was wrong, I would get in again there, still be wrong, I would get in again there.
And at some point, as long as we’ve got that 80% edge against with us, the mean reversion, I’m gonna be right. And when I’m right, I’m right with three positions. And we get back up to the mean there. Yeah. So, so for those using the EA and trying to build strategies with it, which is kind of what I’ve done this session for, make sure you know what you’re building your kind of EA to do. If you’re building it to take advantage of range bound or sideways movement or trending conditions where you’re getting lots of pullbacks, keep your TPs small to make sure that you give the EA the opportunity to get you out of those trades.
So, you know, don’t go for those five to one, six to one risk rewards on something that is going to spend 80% of its time going up and down, because you’re just going to be stuck in those trades for ages and you will get stopped out of them. So if you’d taken a mean reversion entry there, for example, you’ll stop there and you’d set a five to one or 10 to one TP somewhere up in the sky up here, all that’s going to happen is for three or four days, it’s going to chop you around and then it’s going to take you out.
Then yeah, and then look, came up and hit your TP. But with mean reversions, you could have been in and out four or five different times. So much better way of trading. So yeah, so that’s really kind of what I wanted to look at and explain the difference between the two and why I trade in the way that I trade and also why I basket trade. Because with mean reversion strategies, they’ve got a very, very high strike rate typically. So those who know how I trade, I use the market reverse alerts indicator, I use the RSI as an extended condition. And as such, I get somewhere between a 50 to 60% the same strike rate with that strategy. But the TP is always very, very, very difficult to work out. You don’t know what it’s gonna be, do you? So if you go for a very, very small TP, but if you’re wrong, give yourself the opportunity to get in multiple times, eventually, one of those reversals, those mean reversions, will be correct and give you the opportunity to get back out of the trade.
And as long as you’re pulling your TP up with multiple entries, as well as getting into multiple entries, the mean that you need to get back to is always gonna be fairly close to your average price. And that’s basically the strategy in a nutshell, isn’t it? That we trade on a day-to-day basis in the live run. So, yeah, any questions on that, on mean reversion and trending? And does that make sense? So Andy, what happens if the price breaks out of the range and we have a trade on the opposite direction? Right. So yeah, I think I’ve just covered that. So if you are trading with a stop loss, yeah, you’re going to get stopped out. Simple as that. Yeah. So if we are saying this is our range, right?
We’re mean reversion trading. When we get down to this area support, we’re gonna look for a reversal alert and we’re gonna get in. Our stock goes under there. We go for a mean reversion, a 1.2 to one or something small. If it pulls back down, stops us out. If you’re using a stop, obviously, that’s what happens, you get stopped out. But 80% of the time, price does that.
Yeah, or it does that. So as long as you’re getting in at the points where you think are the extremes, your strike rate is going to be very, very high. If you’re going to basket trade, obviously, then it doesn’t really matter, does it, where your entry is, because as long as the mean reversion state stays intact, you are going to get an opportunity to get out. If it breaks out, you need to make sure that you obviously keep scaling into your position so that when you do get that reversion start to happen, you get an opportunity to get out at break even at the worst case scenario.
We’ll have a look at Bollinger Bands as well. I’ll tell you, I should put some Bollinger Bands on the chart. Because they’re a good example of standard 20, 22. This is just a bog standard Bollinger Bands. So this is a really common mean reversion strategy. A lot of people use this on low time frames for scalping. So basically the idea of the strategy is when price gets extended outside you wait for some kind of reversal to start and then you take an opposite trade. So the idea is it will bounce, as you can see, off the Bollinger Bands.
So it bounces off the Bollinger Bands. So as price pushes down outside the Bollinger Bands, you will put maybe a pending entry above the candle and wait for price to break above there and then you will take a stop there and go for a one-to-one. Yeah, stop loss or a 1.2 or a 1.5 or whatever you want to take. Price pushes up outside the Bollinger Bands, shows a bearish engulfing, sell there, get triggered, look for a one-to-one or a 1.5 or 1.2.
You put your stop wherever you want to, but you can see the process yeah pushes outside mean reverts pushes outside mean reverts pushes outside mean reverts pushes outside mean reverts outside mean reverts very very very high strike rate because we know the market spends most of its time doing this. Some really good examples here in a trending market. So price is going up. Yeah. When it pulled outside of these Bollinger Bands here, and you saw that shooting star going, you could have set your step sell order there with the stop up here. You may well have got stopped out on that one, but what did it do after that? I mean, reverted. Yeah. Would it have given you a one-to-one or a 1.1, 1.2, 1.3? Yeah. But you need to work out whatever strategy you build, you need to work out what you want your reward to be. And that’s just done by backtesting. So you would look at how many times it got outside. Let’s say, for example, your strategy was literally it got outside, every time it put in tweezer tops or it put in a shooting star outside the Bollinger Bands, you would set a pending order, if that pending got triggered you would then back test it to see would it hit one-to-one? Yes, 80% of the time. There you go, you’ve got a strategy. If 80% of the time it hits a one-to-one, that’s a profitable strategy. If it hits it 50% of the time, it’s breaking, 55% of the time you make money.
If it would give you enough to go to 1.2 to one, 60% of the time you’re profitable. If it gave you a two to one, 55% of the time, you’re massively profitable. But you need to back test. Yeah, so there, for example, shooting star outside the Bollinger Bands pending order. Boom. Yeah, sometimes it’s not gonna work. That’s a doji.
That’s probably a shooting star. You would have taken that one and you’d have got stopped out on that one. Yeah, not gonna work every time, but you’ll find it will have a very, very, very high strike rate. As opposed to sitting here, waiting, and getting stopped out multiple times. So I’m doing a trend-based strategy.
It’s broken out. I’m gonna take a long, stopped out. It’s broken out. I’m going to take a long, stopped out. Broken out. I’m going to take a long, stopped out. Yeah. How many times do you get stopped out waiting for a trend to start? What could you have been doing instead of getting stopped out waiting for a trend to start? Making money in both directions. Yeah. But yeah, so So this is a really simple example, Bollinger Bands. And all Bollinger Bands are a moving average. This is a 20 moving average, and this is two standard deviations away from that moving average.
So all the Bollinger Band is doing is saying, this one’s got twice as far as normal away from where it normally goes to. What do you think is gonna happen after that happens? People are gonna wanna take profit because they’ve made some money. So what happens? It reverts back to the mean. Pushed out, reverts back to the mean. Pushed out, reverts back to the mean. Pushed out, went to the opposite side, went almost to the opposite side, but reverts to the mean. Yeah. So, and this works on any timeframe. It’s fractal. The market’s fractal. So it works on M15, works on hourly, yeah, works on every timeframe.
Because the market spends 80% of its time doing exactly that, going sideways, even when it’s trending. Yeah, you could do it on there as well. But whichever indicators you use, if you use moving averages, you use Bollinger Bands, you can use RSI, you use stochastics, whatever you wanna use for mean reversion. You just want something that really nicely measures when you’re going up and down and up and down. That’s what it is, isn’t it?
But if you scale in, just as I was just asked, but if you scale in, your risk reward goes out of the window. If you scale in with multiple positions, you mean, and not stock loss. If you scale in, your average price also gets dragged along with you, doesn’t it? So your risk reward is the same. So let’s do an example. So let’s say, for example, you get in pending order, pending order, pending order, pending order, pending order, pending, pending, pending, pending, pending, pending, pending, wouldn’t have got triggered all the way up to there.
That is my first pending order, I reckon, after that got outside the Bollinger Bands. I’m just using this as a making up a strategy to go along. But that’s the first time it would have got out of there. So instead of me getting stopped out, let’s say it pushed up again and I took another position there. My average now is here, isn’t it? Yeah. So to get back to mean reversion, I’m one to one, yeah?
Hasn’t changed, because my average has changed. If I take a position here, yeah? And a stop there, and my TP there, for example, that’s a single entry. If I then take another entry here, yeah? My average is there. So now I’m not targeting here anymore, I’m targeting here. So the more you scale in to a position that goes against you, the higher up your average price moves, the less distance you have to get to a mean reversion strategies, a lot of the time people use a stop loss because they have such a high strike rate, as I say. If you think about it, if you, let’s say for example, you went for a one-to-one risk reward, yeah, which is awful.
You should never really do that. If you had a 55% strike rate with a mean reversion strategy at one-to-one risk reward, you’re making money. If you up that to 1.2 to 1 with a 55 percent strike rate, all of a sudden you’re making a really nice income. If you’ve got to 1.5 to 1, now we’re talking. Yeah, big money. But, you know, mean reversion, and as I say, the reason I came up with this was because of the EEA. Because people are trying with the EEA to put together mean reversion strategies with four to one risk reward. And you have to understand you’re not gonna do that.
So using RSI, for example. So take reversal alerts when the RSI is extended, you can’t go for 5 to 1. You’re going for 1.5 to 1, not 5 to 1, because you’re trading mean reversion. You’re trading using the RSI. And the RSI is basically telling you when something is getting to an extreme level. And yeah, I mean, it’s not always going to work, as you can see here, the RSI I’m sorry, doesn’t always work. But you’re gonna get stopped out. And that’s what happens in trading, isn’t it? Yeah, as long as your risk reward is right, which is the whole point of this, is explaining the difference between a trend-based strategy and a mean reversion strategy.
And the main difference is your risk reward. If you’re waiting to capture a trend, you’re gonna need to wait a long time for that reward to come in. With a mean reversion, if you’re trading on M5 or M15 with mean reversion with a reversal alert indicator, you’re gonna get out really, really quick, multiple times a day. You’re gonna get multiple opportunities a day to make that 1.2 or 1.5 R.
Okay, so yeah, that’s it really.




