
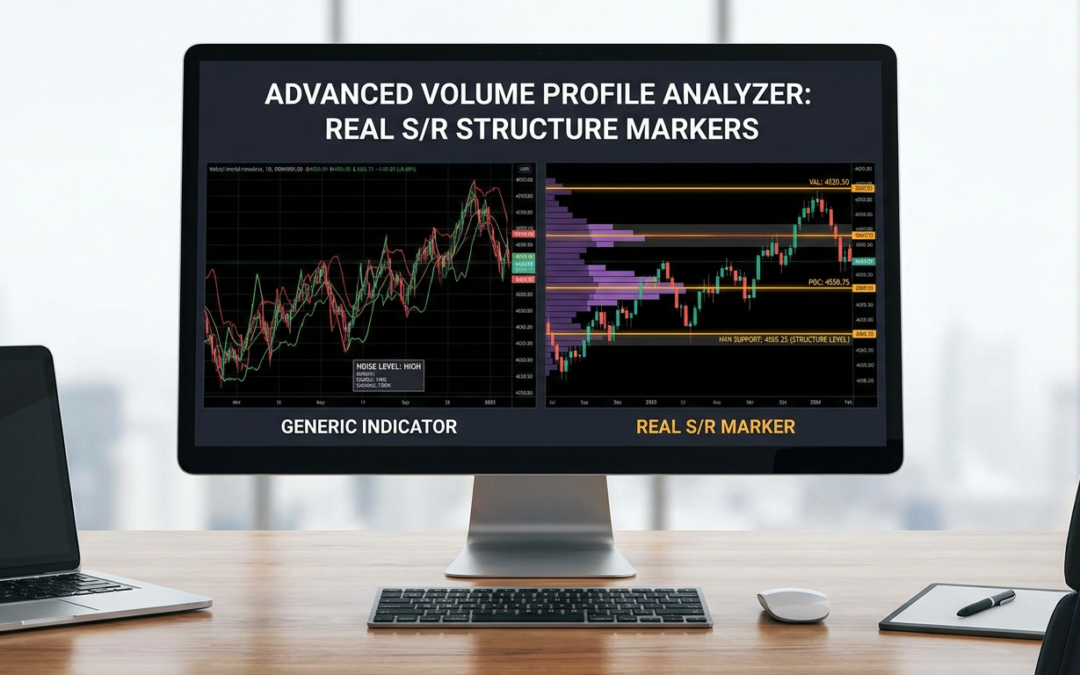
Open ten different “support and resistance” indicators on MT4 or MT5 and you’ll get ten slightly different versions of the same trick: find swing highs, find swing lows, draw a horizontal line, call it a level. Some smooth it with a moving average filter. Some add a “strength” score based on how many times price touched the line. None of it tells you where the actual trading happened.
That’s the gap volume profile is supposed to fill. Instead of asking “where did price turn last time,” it asks “where did the most volume actually trade.” Those are different questions, and the second one is a lot closer to how real support and resistance forms. But most volume profile tools sold to retail traders are half-built, and a lot of traders never learn what to check before they trust the levels.
Why Swing-Based S/R Keeps Failing You
Fractal-based S/R indicators have a structural weakness: they only know about price, not participation. A swing high that formed on a five-minute spike with almost no follow-through gets treated exactly the same as a level where price consolidated for three days. Both draw a line. Only one of them means anything.
This is why you’ll place a trade at a “key level” from a generic indicator and watch price slice through it without even a pause. The line was mathematically correct (it was a local high) but structurally meaningless (nobody was actually transacting there in size).
Volume profile flips that logic. It builds a horizontal histogram of activity across a price range, showing you exactly which prices attracted the most trading and which prices got skipped over entirely. The levels it produces aren’t guesses about where price might react. They’re a record of where it already did.
The Core Concepts You Need the Indicator to Get Right
If you’re evaluating a volume profile tool, whether you’re buying one or trying to code your own in MQL5, there are a handful of concepts that separate a real implementation from a cosmetic one.
- Point of Control (POC): the single price level with the highest traded volume in the profile. This should act like a magnet and often the strongest intraday S/R level on the chart.
- Value Area: typically the range containing 70% of the volume around the POC. Price entering or leaving this zone is a real event, not decoration.
- High Volume Nodes (HVN): clusters where trading concentrated. These tend to become areas of consolidation and repeated reaction.
- Low Volume Nodes (LVN): gaps in the profile where very little traded. Price tends to move through these quickly, which makes them useful as breakout confirmation zones or fast-travel corridors.
A tool that only draws a POC line and calls itself “volume profile” is giving you a fraction of the picture. The nodes and the value area are where the actual trading decisions live.
The Forex Volume Problem Nobody Talks About
Here’s the part that trips up a lot of retail traders building or buying these tools for forex and indices: there’s no centralized volume in FX. What you’re actually getting from your broker is tick volume, a count of price changes, used as a proxy for real transaction volume.
Tick volume correlates reasonably well with real volume in liquid pairs during active sessions, but it’s not the same thing, and any indicator claiming to show “true volume profile” on EUR/USD is stretching the truth. This isn’t a reason to throw the concept out. It’s a reason to demand that the tool is transparent about what it’s measuring and to weight the profile more heavily during high-liquidity windows (London/New York overlap) where tick volume tracks real activity more closely.
Fixed Session vs. Rolling Viewport
This is the single biggest functional difference between a toy indicator and a tool you can actually trade with.
A fixed-session profile recalculates once per day, session, or week and locks in. It’s useful for marking where yesterday’s or last week’s volume concentrated, which matters for gap fills and multi-day S/R.
A rolling or “viewport” profile recalculates continuously based on whatever range is currently visible on the chart, or a fixed lookback window that updates bar by bar. This is far more useful for active structure trading because the levels adjust as new volume comes in instead of going stale the moment a new session starts.
The best setups actually give you both: a fixed anchor (session open, weekly open) for context, and a rolling profile for the live tactical picture. If a tool only does one of these, know which one you’re missing and plan around it.
How to Actually Test One Before You Trust It
Don’t take a sales page’s word for it. Run this checklist on any volume profile indicator, whether you built it or bought it.
- Load it on a range of pairs and indices, not just the one used in the demo screenshots. Tick volume behaves very differently on GBP/JPY than it does on a low-liquidity cross.
- Check whether HVN and LVN zones actually produced reactions historically. Scroll back 100+ bars and eyeball whether price stalled at high-volume nodes and moved fast through low-volume gaps.
- Confirm the POC recalculates and shifts logically as new bars form, rather than freezing or lagging several bars behind.
- Test it against a plain swing-based S/R indicator on the same chart. If the volume profile levels and the fractal levels never line up, one of them is noise.
- Look for confluence, not replacement. The strongest levels are where a volume node and a structural swing point (a prior break of structure, a liquidity sweep, a range high/low) sit on top of each other.
Volume Profile Is a Confirmation Tool, Not a Standalone System
This is worth saying plainly because a lot of traders buy a volume profile indicator expecting it to replace their structure analysis entirely. It won’t, and it shouldn’t.
Volume profile tells you where activity concentrated. Market structure tells you what price is doing right now in relation to that history, whether it’s breaking out, retesting, or reversing at a level. The edge comes from combining the two: waiting for price to reach an HVN or the POC, then confirming with an actual structural signal (a rejection wick, a break of a minor swing, a shift in momentum) before you commit size.
A generic S/R indicator gives you a line and a guess. A properly built volume profile gives you a reason. That difference is exactly why it’s worth the extra effort to evaluate one properly, whether you’re coding your own in MQL5 or picking one to run alongside the rest of your structure toolkit.