
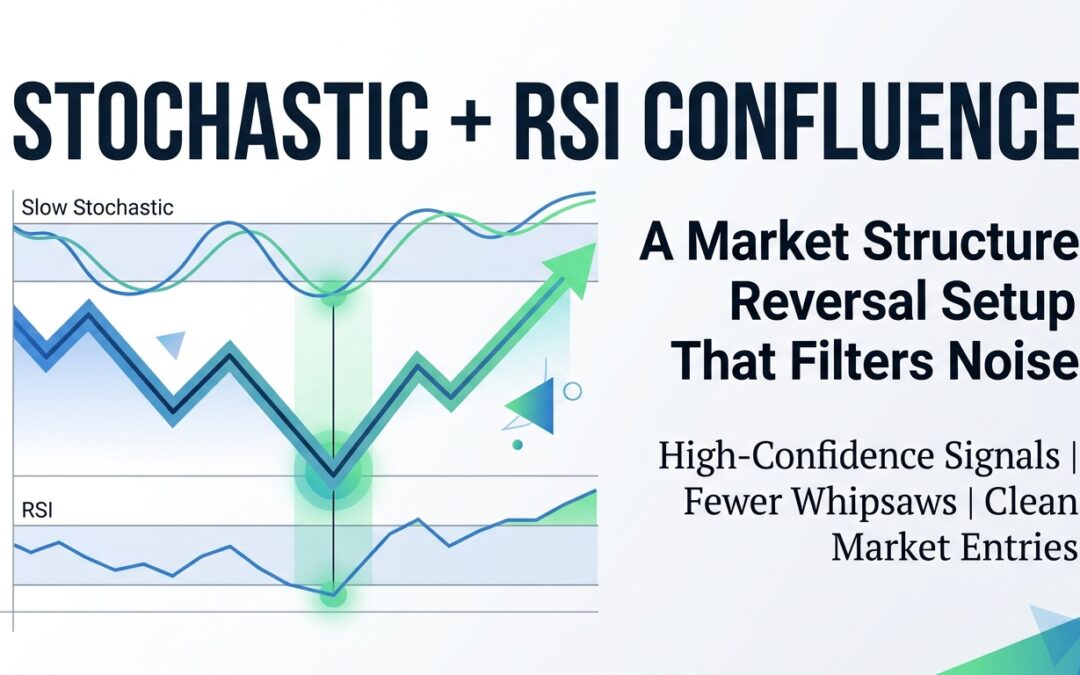
One oscillator giving you an oversold reading is interesting. Two oscillators giving you the same reading at the same time, inside a clear market structure zone, is a trade worth taking seriously. That is the core logic behind combining the slow stochastic with the RSI, and it is a pairing that serious traders have used for decades for good reason.
The problem most traders run into is treating these indicators as standalone signals. RSI flashes oversold, they buy, price keeps dropping. Stochastic crosses up, they enter, price chops sideways for two sessions and stops them out. The solution is not a better indicator. It is confluence, used with structure.
Why These Two Oscillators Complement Each Other
RSI and slow stochastic measure momentum differently, and that difference is the point. RSI compares average gains to average losses over a fixed period, making it more responsive to sustained trending moves. Slow stochastic compares the closing price to the high-low range over a lookback period, making it more sensitive to short-term price compression and expansion within a range.
When both agree, you are seeing momentum exhaustion from two independent angles. A single oversold reading can be noise. A dual oversold reading, especially at a meaningful price level, is a much harder case to dismiss.
The general rule of thumb that circulates among technical traders is that RSI performs better in trending markets while stochastic is more useful in choppy or sideways conditions. Rather than choosing one, you use both, which means your setup has coverage across different market phases.
Setting Up the Indicators Correctly
Default settings are a starting point, not a destination. Here is what works well for swing trading on the 4-hour and daily charts:
- Slow Stochastic: Period 14, %K smoothing 3, %D smoothing 3. Oversold below 20, overbought above 80.
- RSI: Period 14. Oversold below 30, overbought above 70. Some traders tighten this to 25 and 75 to reduce false reads in choppy conditions.
If you are trading on MT4 or MT5, both indicators are built in. Load them on separate sub-windows so you can read them independently without one influencing your visual read of the other.
The Market Structure Layer You Cannot Skip
Here is where most articles on this topic fall short. They describe the oscillator rules and leave it there. But without a structural anchor, you are just trading indicator signals into random price space.
Before you look at either oscillator, locate the relevant structure on your chart:
- A clear swing high or swing low that the market has respected before
- A demand or supply zone formed by a sharp impulsive move away from a consolidation
- A prior area of liquidity (equal highs, equal lows, or a visible stop cluster)
You want price to be arriving at one of these zones when your oscillator confluence triggers. The setup without this context will produce roughly as many losers as winners. The setup inside a genuine structure zone tilts that ratio meaningfully in your favour.
The Long Entry Setup, Step by Step
Walk through this exactly and in order. Do not skip steps or rearrange them.
- Identify a clear market structure low, demand zone, or swing support on the daily or 4-hour chart.
- Wait for price to return to that zone. You are not chasing moves; you are waiting for the market to come to your level.
- Confirm that the slow stochastic %K is below 20 (oversold) and beginning to curl upward, or has crossed above %D from below the 20 line.
- Confirm that RSI is below 30, ideally between 20 and 30, and is flattening or turning up.
- Look for a bullish close on the current candle. Specifically, a candle that closes above the midpoint of the most recent down-leg is a strong entry signal. This tells you buyers absorbed the selling pressure and are asserting control.
- Enter on the open of the next candle, or use a limit order back into the body of the signal candle if you want a tighter entry.
The short entry setup mirrors this exactly, with stochastic above 80, RSI above 70, and a bearish close that cuts back through the midpoint of the prior up-leg at a structural high.
Stop Placement and Managing the Trade
Your stop goes below the structural low that anchored the setup, not below the entry candle. You are giving the trade room to breathe while invalidating it only if price proves the structure wrong.
For exits, a trailing stop works well here because reversal trades from structure tend to run in phases rather than straight lines. A practical approach is to trail your stop below each successive higher swing low on the entry timeframe as the trade develops. This keeps you in strong moves while protecting profits as momentum fades.
Avoid targeting fixed pip counts unless you have a specific reason based on the chart. Let the structure guide you. If there is a clear resistance level three times your risk distance away, that is a reasonable first target. Take partial profit there and trail the remainder.
What Makes This Setup Fail (And How to Screen for It)
The most common failure mode is entering on dual oversold readings during a strong downtrend with no genuine structural support beneath price. Both oscillators can stay oversold for a long time in a trending market. This is not a flaw in the tools; it is a reminder that they need structural context to perform.
A few filters that improve the setup’s reliability:
- Check the higher timeframe trend before entering on a lower timeframe signal. A 4-hour reversal setup carries more weight when the daily chart is at a major support and is not in freefall.
- Avoid the setup when price is inside a compressed range with no clear swing structure. Choppy price without obvious levels produces too many false signals even with dual confirmation.
- Look for volume expansion or a wide-range candle at the signal point. Either tells you the reversal is attracting genuine participation rather than drifting back toward your level on thin air.
Putting It Together in Practice
This is not a high-frequency setup. On the daily chart you might see two or three qualifying setups in a given month per instrument. That is fine. The goal is high-probability entries, not constant activity.
If you run a currency pair watchlist, apply these criteria across six to ten pairs and you will find enough setups to stay active without compromising standards. On MT4 or MT5, you can build an alert based on stochastic and RSI thresholds so you are not staring at screens waiting for the signal to appear.
The discipline is in waiting for all three elements to align: price at structure, dual oscillator confluence, and a confirming candle close. When all three are present, you have an argument for the trade that is grounded in both price behaviour and momentum exhaustion. That combination is as close to a high-probability setup as technical analysis gets.