
One of the most frustrating experiences in trading is watching a clean-looking breakout reverse immediately after you enter. The candle wicks past a key level, your stop gets hit, and price then moves in the direction you originally anticipated. False breakouts are a tax on impatient entries, and most traders pay it repeatedly before they figure out what is missing: confirmation.
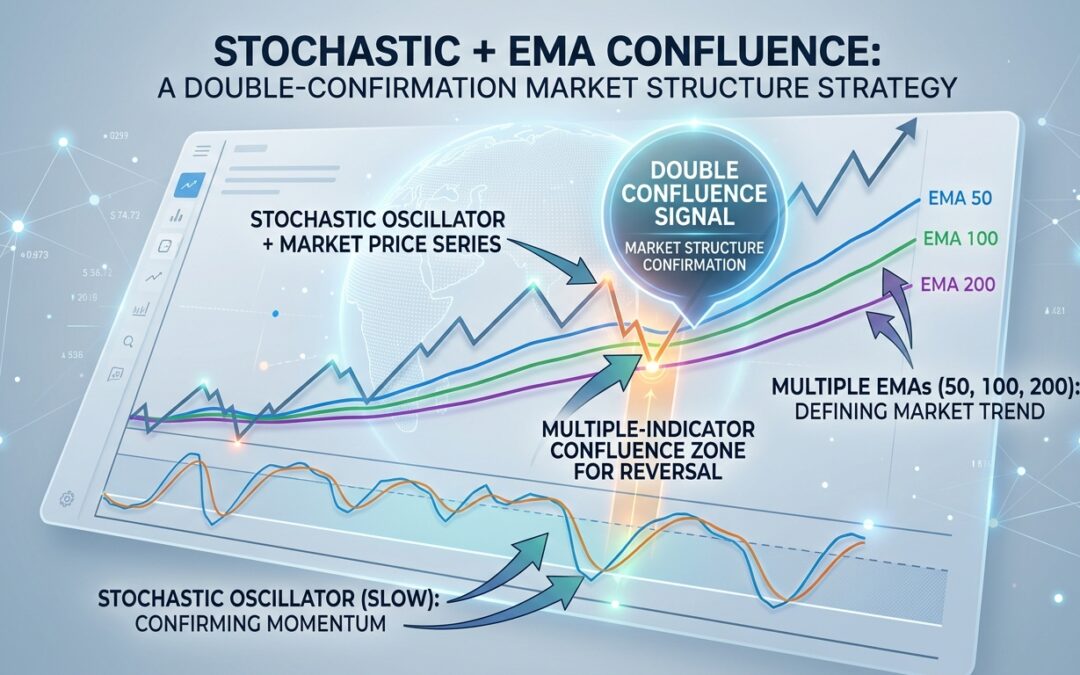
The fix is not a smarter indicator. It is a smarter combination of indicators. When a slow stochastic and two EMAs agree on the same signal, the probability of a sustainable move rises significantly. This is the core idea behind a dual-confirmation market structure approach.
Why Single-Indicator Entries Fall Short
A moving average crossover tells you about momentum and trend direction. A stochastic oscillator tells you about overbought and oversold conditions relative to recent price range. Each one has blind spots on its own.
EMAs can keep you in a trending move, but they lag. By the time the crossover fires, a portion of the move has already happened. The stochastic can fire early in a strong trend, generating repeated overbought readings that mean nothing until momentum actually stalls. Use them together and you cover each other’s weaknesses.
The Setup: Two EMAs and a Slow Stochastic
For this strategy you need three components on your chart:
- A fast EMA, typically the 10-period or 13-period
- A slow EMA, typically the 21-period or 50-period
- A slow stochastic oscillator set to 14,3,3 (period, smoothing, signal)
The EMA pair defines the structural bias. When the fast EMA is above the slow EMA, the market is in a bullish phase. When it is below, the market is in a bearish phase. This is your directional filter and it should never be ignored.
The stochastic provides the timing layer. Even in an uptrend, price pulls back and the stochastic dips below 20. That reading tells you the short-term momentum has exhausted to the downside within a larger bullish structure. The reversal back above 20 is where you look to enter, not at a random candle during the trend.
Reading Market Structure Before You Apply the Indicators
Before the indicators even matter, you need to know what kind of price action environment you are in. Is price making higher highs and higher lows? Then you are trading in a bullish market structure. Lower highs and lower lows? Bearish structure. A choppy range without clear swing points? Neither indicator combination will save you there.
The best setups appear when price has pulled back to a previous swing high turned support (in an uptrend) or a previous swing low turned resistance (in a downtrend). That structural level adds a third layer of confirmation on top of the EMA alignment and the stochastic signal.
Serious traders use tools like the Market Structure Dashboard on MT4 or MT5 to identify these swing points quickly across multiple pairs. Manual observation works too, but automation removes the subjectivity.
Long Entry Rules
A valid long setup requires all of the following to align:
- The fast EMA is above the slow EMA, confirming bullish structural bias
- Price has pulled back toward or slightly below the fast EMA
- The stochastic has dropped into or near the oversold zone (below 20) during the pullback
- The stochastic %K line crosses back above %D from below the 20 level
- A bullish reversal candle (engulfing, pin bar, or inside bar breakout) forms near a structural support level
Entry is placed on the close of the confirmation candle or at the break of its high. Stop loss goes below the most recent swing low, below the structural support zone. Target is the next swing high or a 1.5R to 2R multiple of your risk.
Short Entry Rules
Mirror the logic for shorts:
- The fast EMA is below the slow EMA, confirming bearish structural bias
- Price has retraced upward toward or slightly above the fast EMA
- The stochastic has pushed into or near the overbought zone (above 80) during the retracement
- The stochastic %K line crosses back below %D from above the 80 level
- A bearish reversal candle forms near a structural resistance level
Stop goes above the most recent swing high or above the resistance zone. Target is the next swing low or a defined R multiple.
Avoiding the Most Common Mistakes with This Setup
The single biggest error traders make with this combination is taking stochastic signals that go against the EMA trend direction. If the fast EMA is below the slow EMA and the stochastic dips below 20, that is not a buy signal. It is a continuation signal for sellers once stochastic rolls back down. The EMA alignment is the directional filter and it is non-negotiable.
Another common mistake is entering the moment the stochastic crosses, without waiting for a price action trigger. The cross tells you momentum is shifting. The candle pattern tells you price has actually responded. You need both before committing capital.
Finally, avoid this strategy on ranging markets. When the two EMAs are flat and intertwining, the stochastic will whipsaw between overbought and oversold with no directional context. Step aside until a clear trend resumes.
Timeframe Considerations
This approach works across multiple timeframes but performs best on the 1-hour chart and above for forex pairs, and on the 15-minute to 1-hour range for index futures. Lower timeframes generate more noise and more false stochastic crosses. Higher timeframes, like the 4-hour and daily, produce fewer setups but with considerably higher reliability.
A multi-timeframe approach adds another layer. Confirm the EMA bias on the 4-hour chart, then drop to the 1-hour for the stochastic timing signal and candle entry. This top-down method keeps you aligned with the dominant move while entering at precise, low-risk levels.
Putting the Confluence to Work
The goal with any multi-indicator confluence system is not complexity for its own sake. It is about stacking enough independent evidence that when all filters align, the trade has a genuinely higher probability of succeeding. EMA trend direction, stochastic timing, and market structure support or resistance each measure something different. When they converge at the same point, that convergence is meaningful.
Build this setup on your charts, back-test it on a currency pair you actively trade, and note how often the triple-confirmation setup outperforms taking either indicator in isolation. The numbers will make the case better than any theory can.