
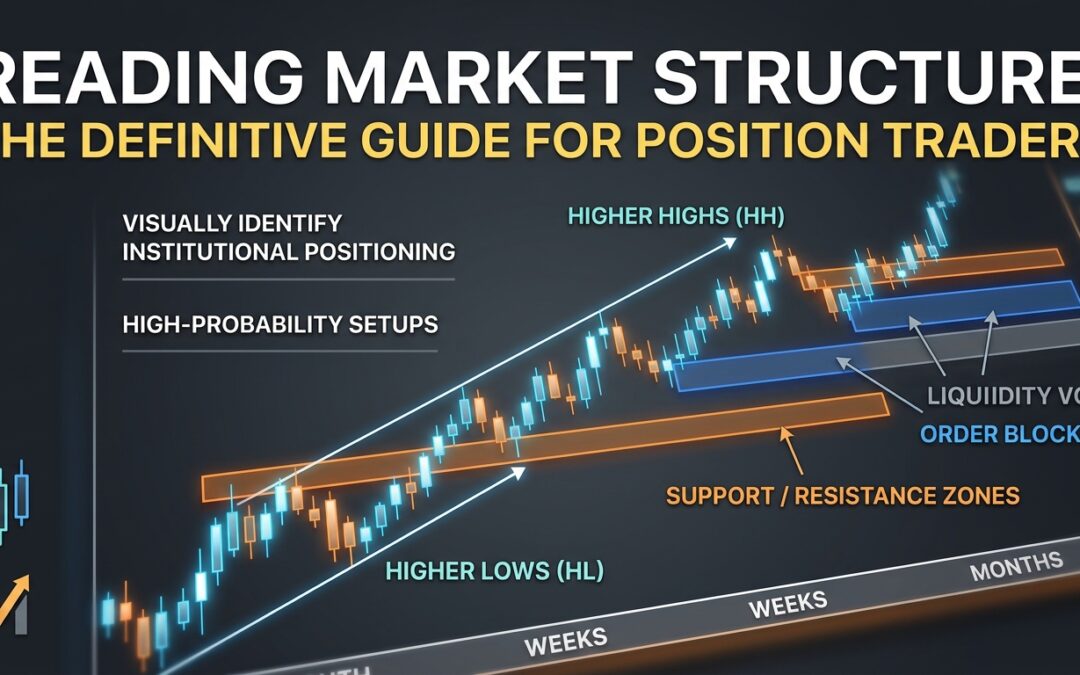
Most retail traders look at a price chart and see noise. Experienced position traders look at the same chart and see a roadmap. The difference comes down to one skill: reading market structure. Once you understand how price actually moves, where institutions are positioned, and which levels have the most weight, everything else in your trading process becomes sharper.
This guide walks through the core elements of market structure that position traders need to master. Not theory for its own sake, but practical, visual concepts you can apply directly on your MT4 or MT5 charts.
What Market Structure Actually Tells You
Market structure is the framework created by how price swings up and down over time. It captures trends, ranges, and transitions between those states. The reason it matters so much for position trading is that it gives you context. A candle or signal in isolation means very little. The same signal inside a clear structural shift means a great deal.
At its core, structure is built from three repeating elements:
- Trend legs (impulsive moves in one direction)
- Swing highs and swing lows (the peaks and troughs that define direction)
- Consolidation phases (where price pauses, compresses, and reloads)
When a market is trending upward, price creates a sequence of higher highs and higher lows. A bearish trend does the opposite: lower highs and lower lows. Consolidation sits between those phases, and this is where most traders get shaken out or confused. Position traders who can read that compression correctly gain a timing edge over the crowd.
Identifying Structural Breaks and Shifts
One of the highest-probability signals in market structure trading is a break of structure (BOS). This happens when price clears a previous significant swing high in an uptrend, or a previous swing low in a downtrend. A clean BOS confirms continuation and is a reliable trigger for pullback entries in the direction of the trend.
More significant is the change of character (CHOCH). This occurs when price violates a structural level that should have held. In an uptrend, a CHOCH happens when a swing low is broken. That tells you the market is no longer respecting the prior trend. Smart money may be repositioning. A change of character is often the earliest signal of a reversal, well before any indicator fires.
The key to reading these correctly is context. A BOS on the 15-minute chart means very little if the daily chart is still in a ranging phase. Always work from higher timeframes down to execution timeframes. Identify the structure on the daily or four-hour chart first, then drill into the one-hour or 15-minute to time your entry.
Support and Resistance Zones (Not Lines)
Most trading courses teach support and resistance as flat lines. In practice, they are zones. Price rarely reverses from a single price point. It reverses from areas where supply or demand was previously significant enough to turn price around.
When you identify a swing low, do not draw a line through the wick. Mark the zone between the candle body and the low of the wick. That zone represents the range of prices where buyers stepped in. The same logic applies to resistance. When price returns to that zone, you are looking at a high-probability reaction area because institutional orders are often resting there.
For position traders, the most powerful zones are those that:
- Were formed on higher timeframes (daily, weekly)
- Caused a sharp impulsive move when originally broken
- Have not been revisited many times (the more touches, the weaker the zone)
- Align with a structural bias (zone as support in an uptrend, zone as resistance in a downtrend)
Order Blocks: Where Institutional Orders Live
An order block is a specific type of supply or demand zone that formed just before an impulsive structural move. The idea is that large institutions cannot fill entire positions in one transaction. They place orders across a range of prices, and the consolidation or small reversal candles just before a big move represent the last point where those orders were placed.
To identify a bullish order block, look for the last bearish (red) candle or group of candles before a sharp upward move that breaks structure. That candle range is your order block. When price returns to it, you have a high-probability long setup because institutional buy orders may still be resting in that zone.
For bearish order blocks, reverse the logic: find the last bullish candle before a sharp downward structural break. The zone between its open and close becomes your area of interest for short entries on retests.
On MT4 and MT5, you can mark these zones manually with rectangle tools, or use a dedicated order block indicator to highlight them automatically across multiple timeframes. The visual clarity this adds to your charts is significant, especially when you are trading several pairs or instruments at once.
Liquidity Voids and Why Price Fills Them
A liquidity void is a gap in price where very little trading actually occurred. These appear when price moves so aggressively in one direction that it skips over entire price levels without spending meaningful time there. On a candlestick chart, this looks like a large candle with a very small wick relative to its body, or a gap between candles.
Price has a strong tendency to return to fill these voids. The reason is mechanical: orders that were not filled during the original move are still waiting at those prices. When conditions allow, the market gravitates back to fill that inefficiency before resuming the dominant direction.
For position traders, liquidity voids create two useful scenarios:
- A pullback target when you are already in a trade and want to set a take-profit or partial close level
- A re-entry zone when you missed the initial structural break and want to buy or sell the void fill
The most reliable void fills happen when the void sits inside a broader structural area of interest, such as between a key support zone and an order block. That confluence is what separates high-probability setups from average ones.
Putting It Together: A Structural Trading Framework
Reading individual elements is useful. Combining them into a repeatable process is what builds consistent results. Here is a practical sequence for identifying setups using market structure:
- Determine the higher timeframe trend using swing highs and lows on the daily or four-hour chart.
- Identify the key structural zone where price is likely to react next (support in uptrend, resistance in downtrend).
- Mark any order blocks or liquidity voids within or near that zone.
- Drop to a lower timeframe and wait for a structural signal: a change of character followed by a break of structure in your favour.
- Enter on the first or second pullback after the lower timeframe BOS, with your stop below the last structural low (for longs) or above the last structural high (for shorts).
This framework keeps your trades aligned with institutional positioning rather than fighting it. You are not chasing price. You are waiting for price to come to defined areas and then confirming intent before committing capital.
Common Mistakes That Undermine Structure Trading
Even traders who understand the theory often make the same errors in execution. The most common ones to watch for:
- Marking too many zones and treating every swing as significant. Focus on the levels that caused the largest and cleanest moves.
- Ignoring the higher timeframe bias and taking countertrend trades on lower timeframes without solid justification.
- Entering before confirmation. Waiting for a structural signal on the entry timeframe is what separates a planned trade from a guess.
- Moving stop losses into the structure before the trade has room to develop.
Market structure gives you a map, not a guarantee. Discipline in how you apply it determines whether that map leads to profit or just more chart time.
Using Tools to Streamline Structure Analysis
Manual structure analysis is a valuable skill to develop, but there are MT4 and MT5 tools that accelerate the process. A good market structure indicator will automatically plot swing highs and lows, mark structural breaks, and highlight order blocks as they form. This is particularly useful for traders monitoring multiple pairs across different sessions.
The goal is not to remove your judgment from the process. It is to reduce the time spent on mechanics so you can focus on the quality of each setup and whether the broader context supports taking it. When your tools and your reading of the chart agree, confidence in the trade increases substantially.
Start with one pair, one timeframe hierarchy, and one structural concept at a time. Get fluent in reading clean trending structure before you add order blocks. Add liquidity voids after that. Build the skill layer by layer and your chart reading will become genuinely reliable rather than selectively remembered.