
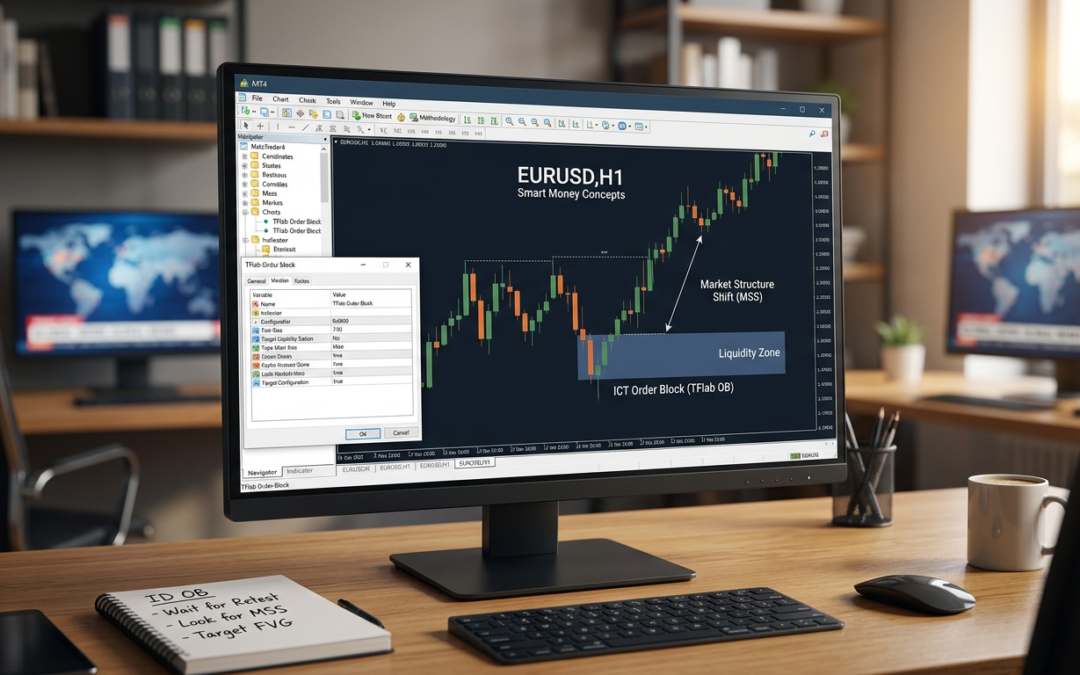
Most retail traders lose money not because they lack discipline, but because they trade against the institutions. Smart money moves the market. Retail money follows. Order blocks are the map that shows you where institutional traders are positioned, and if you can read that map, you stop being the liquidity they hunt.
This guide walks through exactly how to identify valid order blocks using ICT methodology, how to filter the weak zones from the high-probability ones, and how the TFlab Order Block indicator for MT4 fits into a structured trading approach.
What an Order Block Actually Is
An order block is a price zone where institutional activity occurred immediately before a significant directional move. Think of it as the last place a bank or hedge fund was filling a large position before price broke away.
- Bullish order block: The last bearish candle (or cluster of down-close candles) before a strong upward move. Institutions were accumulating long positions here while retail traders saw a downtrend.
- Bearish order block: The last bullish candle (or cluster of up-close candles) before a sharp decline. Smart money was distributing, not buying.
When price returns to these zones later, institutions often defend them again. That defence creates the high-probability reversal setups ICT traders are looking for.
The Validation Criteria That Separates Good Order Blocks from Bad Ones
Not every bearish candle before a rally is a tradeable order block. Applying validation filters is the difference between a methodology and guessing.
A valid order block needs four things working together:
- Liquidity sweep before the zone: Price should have taken out a prior swing high or low (stop hunts, equal highs or lows) before the order block forms. This confirms institutions were engineering liquidity.
- Displacement after the zone: A strong, impulsive move away from the block, often leaving a Fair Value Gap (FVG) in its wake. If price drifts away slowly, the conviction is not there.
- Break of structure: The displacement should break a meaningful swing high or low, confirming a genuine shift in market structure (a BOS or CHoCH on your working timeframe).
- Premium or discount alignment: Bullish order blocks should sit in discount territory (below the 50% level of a recent swing). Bearish order blocks should sit in premium territory. Trading with this alignment keeps you on the right side of the range.
The TFlab Order Block indicator automates much of this validation, flagging zones only when the displacement and structure criteria are met rather than marking every consolidation candle on the chart.
Using the TFlab Order Block Indicator on MT4
The TFlab indicator is freely available and designed specifically for ICT and Smart Money Concept traders on MetaTrader 4. Once installed, it draws coloured rectangles across identified order block zones directly on the price chart.
A few practical points on using it effectively:
- Run the indicator on your higher timeframe first (H4 or Daily) to identify the dominant order blocks. These are the zones that carry the most institutional weight.
- Drop to your entry timeframe (M15 or H1) to look for confirmation. You want to see the indicator mark a valid block on the lower timeframe that aligns with the direction of the higher timeframe structure.
- Pay attention to whether the block has been mitigated. Once price revisits an order block and trades through it without reversing, the zone is consumed and should be ignored. The indicator helps track this, but you need to understand the logic behind it too.
Do not treat every highlighted zone as an automatic entry signal. The indicator narrows the field. Your job is to read the context around each zone.
Reading Market Structure Before You Trade the Block
Order blocks do not exist in isolation. Trading one without understanding the surrounding market structure is like reading a single line of a paragraph and trying to guess the meaning of the full chapter.
Before entering at any order block, answer these questions:
- Is price in an uptrend or downtrend on the higher timeframe? Only trade bullish order blocks in an uptrend and bearish ones in a downtrend unless you have a clear CHoCH (Change of Character) signalling a reversal.
- Has there been a recent Break of Structure that confirms the direction? A BOS means the trend is intact. A CHoCH means a potential reversal is underway. Both create valid scenarios, but they require different management.
- Where is the next major liquidity pool? Institutional traders move price toward liquidity. If there are equal highs sitting just above your bearish order block, smart money may push higher first to grab that liquidity before reversing. That is not a zone to short from yet.
Entry, Stop Loss, and Target Placement
Once you have a validated order block that aligns with structure and higher timeframe bias, the execution mechanics are straightforward.
Entry: Enter at the 50% level of the order block candle (the midpoint) or at the full retest of the block’s high or low. Entering at 50% improves your risk-to-reward ratio but means you may miss some entries. Retesting the full edge gives higher fill rate at the cost of a wider stop.
Stop loss: Place your stop below the low of the order block (for bullish setups) or above the high (for bearish setups), with a small buffer of around 5 to 10 pips depending on the instrument. If price closes through the full block, the setup is invalidated.
Targets: Use the next structural liquidity level as your primary target. This could be a prior swing high, a cluster of equal highs, or the opposing order block on the higher timeframe. A minimum risk-to-reward of 1:2 should be your baseline. ICT-based traders typically aim for 1:3 to 1:5 on clean setups.
Common Mistakes When Trading Order Blocks
Even traders who understand the concept well make avoidable errors in execution. Watch out for these:
- Trading unmitigated blocks that are too old. Blocks lose relevance over time, especially if price has passed through them multiple times without a clear reaction.
- Ignoring killzone timing. ICT methodology emphasises that the highest-probability reactions occur during the London open (02:00 to 05:00 EST) and New York open (07:00 to 10:00 EST). An order block reaction during these windows carries more weight than one during the Asian session.
- Stacking too many confluences and missing the trade. Requiring every single factor to line up perfectly leads to paralysis. Three to four confluences is enough to act.
- Treating the indicator as a black box. The TFlab tool is a visual aid, not a trading system on its own. Understanding why each zone is marked makes you a better trader than simply following the coloured boxes.
Putting It Together: A Sample Trade Workflow
Here is a condensed workflow using this methodology on a forex pair like EURUSD:
- Check the H4 chart. Identify the current market structure trend and locate any significant order blocks the TFlab indicator has flagged.
- Drop to the H1 chart. Confirm the trend structure matches the higher timeframe. Look for a recent BOS in the direction of the H4 trend.
- Wait for price to pull back into a valid H1 order block that sits in the correct premium or discount zone.
- Switch to M15 to refine entry timing. Look for a displacement candle or a CHoCH on this lower timeframe to confirm the reversal from the block.
- Enter, place your stop below the order block, and target the next liquidity level on the H1 chart.
This top-down approach keeps you trading with institutional flow rather than against it, which is the entire point of using order block methodology in the first place.
The TFlab indicator does the heavy lifting on identification. Market structure provides the direction. Patience and discipline provide the edge. Those three together are what make this approach work consistently over time.