
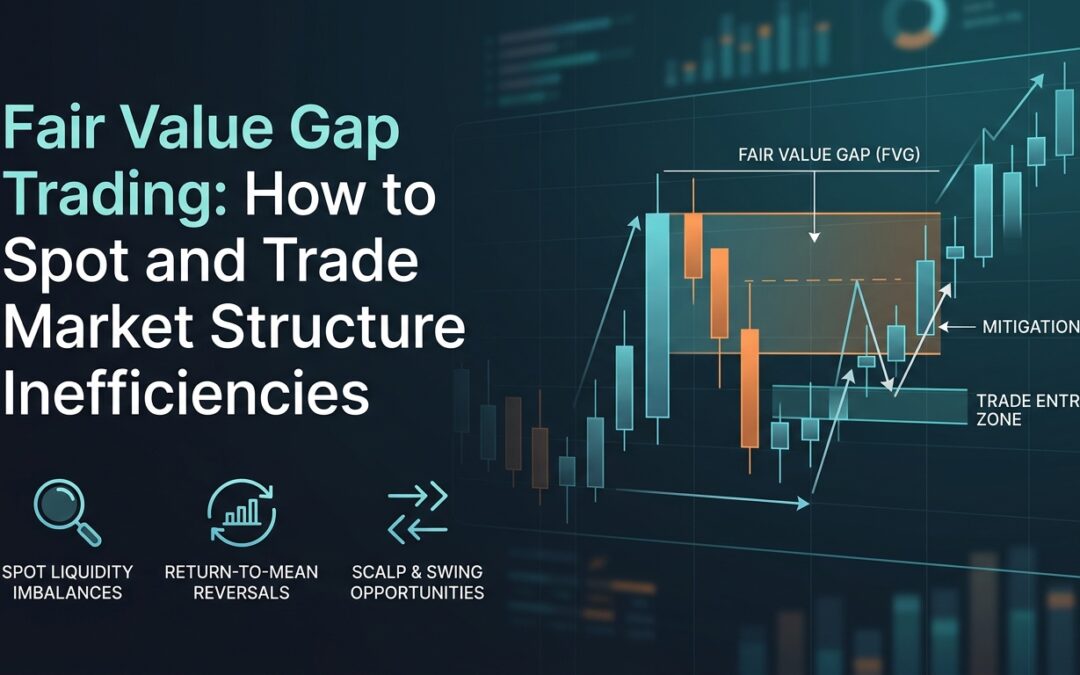
Price does not always move in a clean, orderly fashion. Sometimes it rips through a zone so quickly that a portion of the chart never gets properly tested. That gap between buyers and sellers, where price skipped over real value, is what traders call a fair value gap. And for those who trade market structure, it is one of the most reliable clues the chart can hand you.
What Is a Fair Value Gap?
A fair value gap (FVG) is a three-candle pattern where the middle candle is so large and impulsive that it creates a price zone that overlaps with neither the first nor the third candle. Specifically, the gap sits between the high of the first candle and the low of the third candle on a bullish move, or between the low of the first candle and the high of the third candle on a bearish move.
The key distinction here is that you are not just looking at closing prices. The wicks matter. If the wick of the third candle reaches back into the body of the first candle, there is no gap. The gap must be a clean, untested zone.
This pattern is strongly associated with the ICT (Inner Circle Trader) methodology and the broader smart money concept framework, but the underlying logic is simple: price moved faster than the market could absorb, leaving an imbalance that often draws price back for a retest.
Why FVGs Form and What They Tell You
Fair value gaps form during periods of high-momentum, directional movement. Think of a major news release, a liquidity sweep off a swing high, or the opening range of a London or New York session. In these moments, aggressive market participants are moving size, and price jumps through levels without giving retail order flow a chance to fill in both sides of the market.
That unfinished business is what creates the edge. The gap represents an area where orders were never properly matched. When price returns to that zone, it is revisiting real value, and that often triggers a reaction.
From a market structure perspective, FVGs are not just random gaps. They tend to form in the direction of the prevailing trend, inside impulsive legs that break prior structure. That context tells you whether the gap is worth trading at all.
Bullish vs. Bearish FVGs
It helps to have a clear picture of what each type looks like before you start marking them on your charts.
A bullish FVG forms during a sharp upward move:
- Candle one is a smaller bullish or neutral candle
- Candle two is a large bullish candle that closes well above candle one’s high
- Candle three opens above candle one’s high, leaving a gap between candle one’s high and candle three’s low
A bearish FVG is the mirror image:
- Candle one is a smaller bearish or neutral candle
- Candle two is a large bearish candle that closes well below candle one’s low
- Candle three opens below candle one’s low, leaving a gap between candle three’s high and candle one’s low
When price later returns to either zone, you have the raw setup. What you do with it depends on the broader context.
Combining FVGs with Market Structure
Trading an FVG in isolation is a shortcut to getting chopped up. The gap itself is just a location. Your job is to determine whether price is likely to react at that location or simply blow through it.
The most reliable FVG setups share a few common characteristics:
- The FVG formed inside a clear impulsive leg that broke a prior swing high or low
- The broader trend on the higher timeframe aligns with the direction of the gap
- Price has pulled back into the gap after the initial impulse, rather than reverting before the move extended
- The gap sits near a confluence zone, such as a previous structure level, an order block, or a session open
On a 15-minute EUR/USD chart, for example, if London session breaks above the Asian range high with a large bullish candle and leaves a clear FVG below, a pullback into that gap during the early New York session is a high-probability long entry, provided the daily bias is also bullish.
Entry, Stop, and Target Logic
Once you have identified a valid FVG with structural confluence, execution is straightforward. Most traders enter at the 50% level of the gap, sometimes called the equilibrium of the FVG. Others prefer to wait for price to enter the gap and show a reaction on a lower timeframe before committing.
For stops, placing them just beyond the far edge of the gap is the common approach. If price fully closes through the gap, the imbalance has been negated, and the thesis is wrong. There is no reason to hold.
Targets depend on your timeframe:
- For scalp entries on 5-minute or 15-minute charts, target the most recent swing high or the next area of structure
- For swing entries on the 1-hour or 4-hour chart, use a higher timeframe premium or discount zone as the exit
- Partial exits at 1:1 risk-reward help lock in gains while letting the remainder run
Inverted Fair Value Gaps
When price fully fills and closes through an FVG, that gap flips its role. A bullish FVG that gets completely closed through can now act as resistance on any subsequent rally back into it. This is called an inverted fair value gap (IFVG), and it is a useful filter for avoiding re-entries into gaps that have already lost their significance.
If you see price return to a gap and stall just at the edge without fully entering, that is also worth noting. It can signal strong conviction in the original direction and sometimes sets up an aggressive continuation entry.
Using Indicators to Automate FVG Detection
Manually marking FVGs across multiple pairs and timeframes is time-consuming. An MT4 or MT5 indicator that auto-draws FVGs as they form is a practical upgrade. What to look for in a good FVG indicator:
- Real-time detection on the current candle, not just historical gaps
- Visual display that shows the full gap zone, not just a line
- A filter for minimum gap size so you are not cluttering charts with tiny imbalances
- Alerts when price returns to a gap, so you do not have to watch the screen constantly
Pairing an FVG indicator with a broader market structure dashboard that marks swing highs, swing lows, and trend direction gives you a genuinely efficient workflow. You can assess the structural context at a glance before drilling down to execute the FVG entry.
Common Mistakes to Avoid
A few errors show up repeatedly when traders first start working with FVGs.
- Trading against the trend: A bearish FVG in a strong uptrend is a low-conviction setup. Trend alignment is not optional.
- Chasing price: If price has already moved well past the gap and is not pulling back, the opportunity has passed. Wait for the next one.
- Ignoring gap size: Very small gaps on noisy timeframes produce a lot of false setups. Filter by minimum pip or point size based on the instrument you trade.
- No stop loss discipline: A gap that gets fully closed through is a failed setup. Take the small loss and move on.
Fair value gaps are not magic. They are a structured way to find where the market left unfinished business and to position yourself for the return trip. Combined with solid market structure analysis and proper risk management, they are one of the cleaner tools you can add to a technically-driven approach.