
Market structure is not a concept you learn once and forget. It is something you apply chart by chart, session by session, until reading price action becomes second nature. EUR/USD is the ideal pair to build that skill on. It is the most liquid forex pair in the world, which means cleaner swings, cleaner breaks, and cleaner structure to read.
This walkthrough deconstructs a real EUR/USD structure setup from entry framing to execution logic. No indicators doing the heavy lifting here. Just price, levels, and a disciplined process.
Step One: Define the Trend Using Swing Points
Before you place a single order, you need to know what the market is doing. That means identifying the sequence of highs and lows across your higher timeframes, starting with the daily or the four-hour chart.
In a bullish trend, you are looking for a consistent pattern of higher highs (HH) and higher lows (HL). In a bearish trend, lower highs (LH) and lower lows (LL). The moment that sequence breaks, the trend is in question.
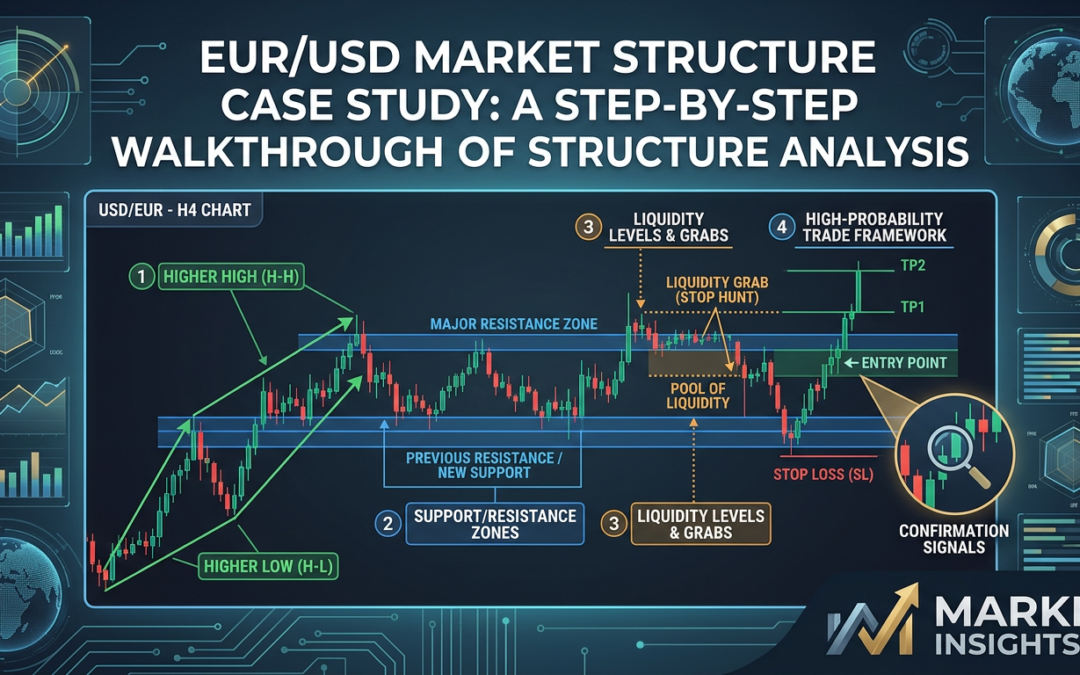
On the EUR/USD four-hour chart, a clean example looks like this: price makes a swing high, pulls back to form a higher low, then pushes up to make a new swing high. That sequence confirmed a bullish structure. As long as the most recent higher low holds, the bias stays long. If it breaks, the structure has shifted and you reassess.
The key mistake most traders make is jumping to a lower timeframe before doing this work. Define the structure first. Everything else flows from that decision.
Step Two: Mark the Key Support and Resistance Levels
Once you have trend direction, you need to identify the levels that matter. These are not arbitrary lines drawn on a chart. They are areas where price has previously reacted, where orders are likely clustered, and where the market has made decisions before.
On EUR/USD, the levels that tend to hold weight are:
- Previous daily highs and lows
- Swing high and swing low points from the past two to four weeks
- Round number levels like 1.0800, 1.0900, 1.1000
- Areas of consolidation before a major breakout
In a bullish structure setup, the most important level is the last higher low. That is your structural support. If price is pulling back toward it, that is where you focus your attention for a long entry. The zone above the most recent swing high becomes your first resistance target.
Do not clutter the chart with every level you can find. Two or three clean, clearly defined zones are worth far more than ten ambiguous lines.
Step Three: Identify the Liquidity Pools
Liquidity is where the orders sit. Understanding where liquidity is concentrated helps you anticipate how price will move, particularly around breakouts and fakeouts.
In practice, liquidity pools on EUR/USD tend to form:
- Above obvious swing highs (buy-side liquidity)
- Below obvious swing lows (sell-side liquidity)
- Around equal highs and equal lows, which are magnets for price
A common EUR/USD setup involves price consolidating just below a previous swing high. Retail traders see resistance and go short. Their stop losses sit above the high. Price sweeps that level, triggers the stops, collects the liquidity, and then either continues bullish or reverses sharply. If the sweep happens at a structure level you have already identified as significant, you have confluence. That is when the setup has real weight.
After a liquidity sweep, look for a reaction. A strong rejection candle, a shift in lower timeframe structure, or a return back inside the range all signal that price has collected what it came for. That is your entry trigger.
Putting the Pieces Together: A EUR/USD Trade Setup
Here is how the full framework looked on a recent EUR/USD four-hour sequence.
The daily chart showed a clear bullish structure, higher highs and higher lows over several weeks. Price had pulled back from a swing high and was approaching a previous area of demand around the 1.0820 region, which also aligned with the last confirmed higher low.
On the four-hour chart, price swept just below 1.0820, dipping into sell-side liquidity sitting beneath that swing low. Within two candles, buyers stepped in and pushed price back above the level. That sweep and recovery signalled that the dip was not a structural break but a liquidity grab.
The entry came on the retest of 1.0820 from below, now acting as support. Stop loss was placed below the sweep low, giving the trade room to breathe. The first target was the previous swing high near 1.0960, a clean 2:1 risk-reward setup.
No exotic indicators. No complex confluences. Just structure, levels, and liquidity working together.
What This Approach Demands From You
Reading market structure is a skill, and like any skill it requires repetition and honest review. A few things that separate traders who apply this well from those who struggle:
- They do their analysis before the session opens, not while price is moving
- They wait for price to come to their level rather than chasing moves
- They accept that not every setup triggers, and that is part of the process
- They review trades at the structural level, not just at the entry and exit level
The premium and discount framework, buying when price is below a key structural midpoint and selling when it is above, is simple to state but takes discipline to execute. The market will always offer something that looks tradeable. Your job is to only take what fits the structure.
Using Tools to Confirm What You See
Manual structure analysis is the foundation, but tools can make the process faster and more consistent. An MT4 or MT5 market structure indicator that automatically plots swing highs and lows removes some of the subjectivity and helps you stay aligned with the dominant structure across multiple timeframes.
The goal is not to have the tool think for you. The goal is to use it to confirm what the chart is already showing. If your manual read and the indicator agree, the conviction behind the trade is stronger. If they disagree, that is a reason to slow down and reassess rather than force an entry.
EUR/USD will keep offering setups. The structure will keep forming. The traders who take the time to understand the language of price, highs, lows, levels, and liquidity, are the ones who consistently know what to do when it matters.