
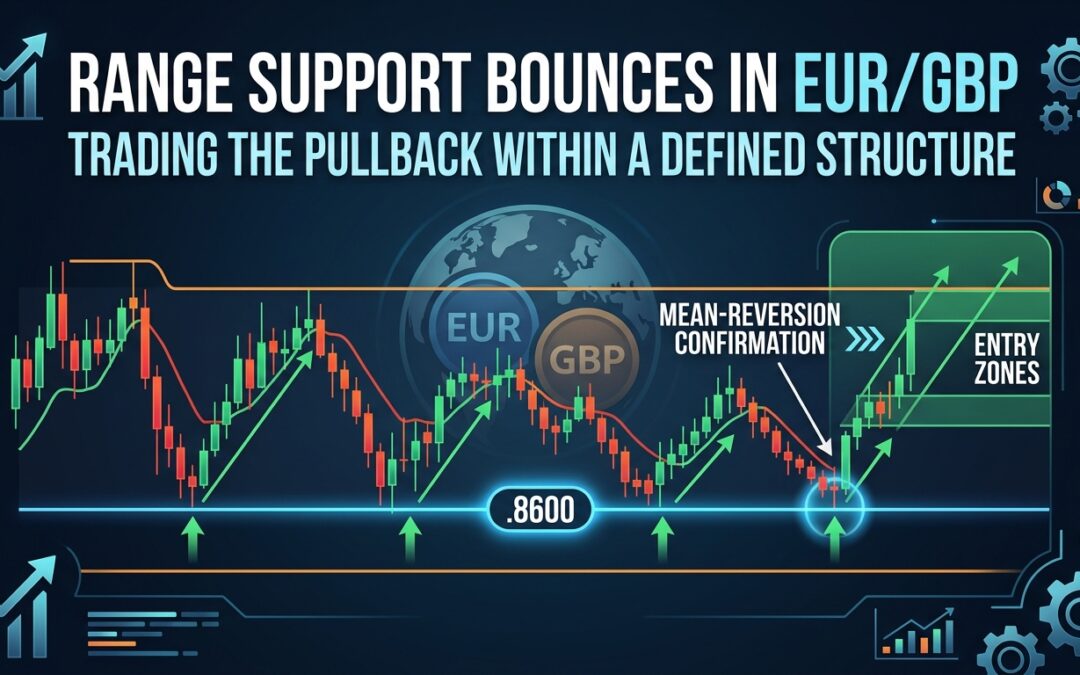
Range-bound pairs are gifts when you know how to read them. EUR/GBP has been printing a well-defined range structure through 2026, and the .8600 level keeps emerging as the key floor. When price dips into that zone and holds, it creates one of the cleaner setups for a structured pullback trade. The trick is knowing exactly when the bounce is real and not just a brief pause before a breakdown.
This breakdown covers the mechanics of the current structure, what confirmation looks like at support, and how to define entry zones that align with the range logic rather than fighting it.
Understanding the 2026 Range Structure
EUR/GBP has spent most of 2026 oscillating inside a relatively compressed range. The upper boundary sits in the .8750 to .8780 area, depending on how you draw the swing highs. The lower boundary is anchored near .8600, a level that has absorbed selling pressure on multiple tests without a convincing close beneath it.
That kind of repeated test-and-hold behavior is not random. It reflects the ongoing tug-of-war between ECB policy expectations and the Bank of England’s rate trajectory. Neither central bank has delivered a definitive move sharp enough to break the pair out of this structure, so the range keeps reasserting itself. For position traders, that is the entire trade thesis: the range is valid until price proves otherwise with a sustained close outside it.
Why .8600 Matters as a Structural Level
Not all round numbers carry weight, but .8600 earns its status for a few concrete reasons. First, it aligns with prior consolidation zones from late 2025, meaning there is historical order flow sitting at that price. Second, it has been tested multiple times in 2026 without a weekly close beneath it, which tells you sellers have not been able to build sustained momentum at that level.
Third, and practically important, .8600 is a natural zone for institutional limit orders. Large participants running mean-reversion strategies tend to load bids near defined structural lows, which self-reinforces the support. When retail selling pressure and institutional buying coincide at the same level, you get the kind of wick rejections and reversal candles that confirm a bounce is underway.
Reading the Mean-Reversion Signal at Support
Mean reversion off range support is not about buying the moment price touches .8600. That approach leads to catching falling knives. The confirmation process matters more than speed of entry. Here is what to look for before committing to a position:
- A clear rejection candle on the daily chart, specifically a bullish engulfing, hammer, or morning star pattern forming at or just above .8600
- A close back above any intraday breakdown level that tested the zone, confirming buyers stepped in with conviction
- Momentum indicators, such as RSI on the H4 chart, turning up from oversold territory (below 35) without diverging from price
- Volume or tick activity (where available on your broker feed) picking up on the bounce candle rather than the selling candle
The goal is to see the pair demonstrate it wants to move back toward the range midpoint, around .8675 to .8690, before you are fully committed. A single wick low with no follow-through candle is not confirmation. Two or three candles holding above .8610 after a dip is a much stronger signal.
Defining the Entry Zone
Once you have a daily close that rejects .8600, you have two practical entry approaches depending on your timeframe and risk tolerance.
The first is an aggressive entry on the retest. After the initial bounce candle, price often pulls back slightly before continuing higher. Entering on that minor pullback, somewhere between .8610 and .8625, tightens your risk and improves your reward ratio. Your stop goes beneath the structural low, typically a few pips below .8595 to account for spread and noise.
The second is a confirmation entry. Wait for the H4 chart to break above a short-term descending trendline or swing high formed during the selloff into support. This entry comes later and at a slightly higher price, but it reduces the probability of entering a false bounce. Stops are placed at the same structural low reference.
Target Zones and Trade Management
In a range-bound environment, your targets should reflect the range, not optimistic extensions beyond it. The logical target sequence for a long from .8600 support looks like this:
- First target: .8670 to .8680 (range midpoint and prior consolidation area)
- Second target: .8720 to .8740 (upper third of the range, below the ceiling)
- Final target: .8750 to .8780 (range ceiling, only if momentum is exceptionally strong)
The standard approach is to take partial profit at the first target and move your stop to breakeven on the remainder. This removes the binary risk while keeping you in the trade if the pair runs back toward the top of the range.
Avoid holding a full position into the range ceiling without a clear fundamental catalyst. Range tops attract sellers just as reliably as range bottoms attract buyers, and EUR/GBP is not showing the kind of breakout momentum that justifies a different assumption right now.
What Invalidates the Setup
Range trades fail when the range fails. A daily close below .8590, especially on elevated momentum, changes the market structure picture entirely. At that point, the .8600 support becomes resistance and the thesis shifts from mean reversion to a potential breakdown scenario.
Also watch for central bank surprises. An unexpected BoE rate decision or a sharp shift in ECB guidance can override technical structure quickly in EUR/GBP. Check the economic calendar before entering any position near a major event. No technical setup is worth holding through a central bank announcement you did not account for.
The Bigger Picture for Position Traders
EUR/GBP is the kind of pair that rewards patience and punishes overtrading. The range has been coherent, the support has been consistent, and the mean-reversion logic is sound. For traders running systematic or semi-systematic approaches with MT4 or MT5 tools, this is exactly the environment where a well-calibrated range indicator or market structure dashboard adds real value, not by finding trades that do not exist, but by filtering for the highest-quality entries within a structure that is already doing the work.
Trade the structure, respect the invalidation level, and let the range do what ranges do. Until .8600 breaks on a closing basis, the bias remains clear.