
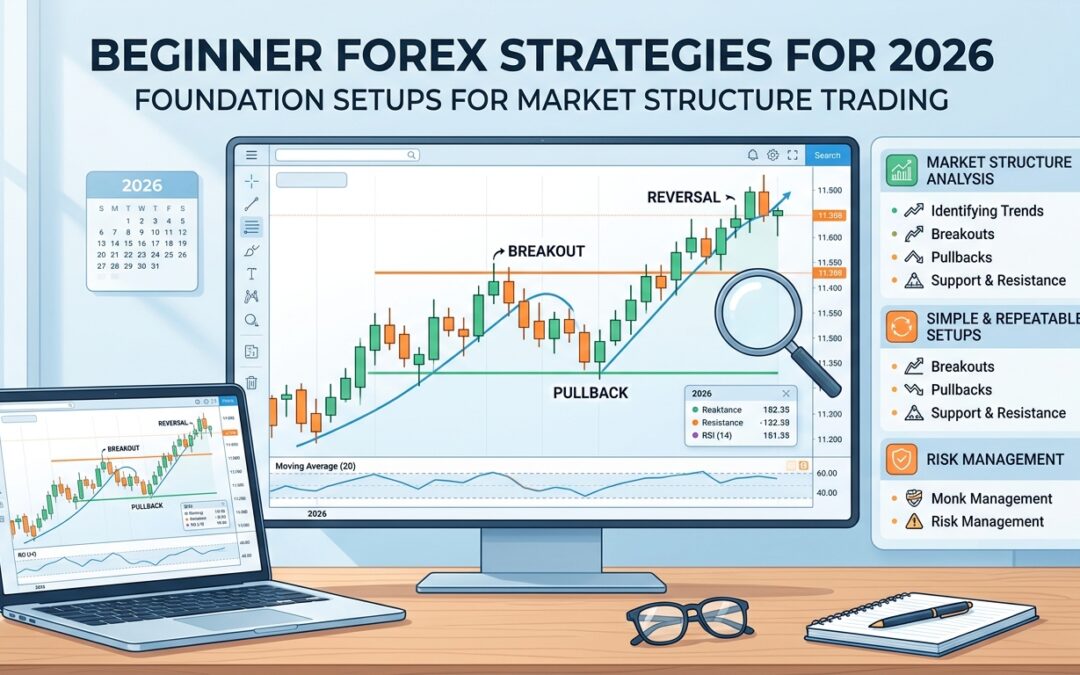
Most beginners enter forex with a handful of indicators, a broker account, and very little idea of what price is actually doing. The result is predictable: they chase entries, get stopped out repeatedly, and eventually conclude the market is random. It is not random. It is structured, and once you can read that structure, everything else clicks into place.
This guide walks through the foundational setups every new trader should build their practice around in 2026. No exotic indicators, no over-optimised algorithms. Just the core concepts that experienced traders use every single day.
What Market Structure Actually Means
Market structure is the pattern of highs and lows that price leaves behind as it moves. An uptrend is defined by a series of higher highs (HH) and higher lows (HL). A downtrend is the opposite: lower highs (LH) and lower lows (LL). When this sequence breaks, you have a potential reversal on your hands.
This is not a complicated concept, but most beginners skip it and jump straight to RSI or MACD. The problem is that indicators lag. Structure is right there on the chart in real time. Learning to read it first gives you a framework for deciding whether an indicator signal is actually worth acting on.
Start by marking swing highs and swing lows on a daily or four-hour chart for any major pair like EUR/USD or GBP/USD. Do this manually for two weeks before you place a single trade. Your eye will start to see the rhythm of price almost automatically.
The Breakout Setup
A breakout occurs when price moves beyond a significant swing high or swing low with conviction. For beginners, the clearest version of this setup involves a consolidation range: price compresses between two levels, then breaks out in one direction.
The key conditions to look for are:
- A clear consolidation range lasting at least 8 to 15 candles on your chosen timeframe
- A clean break of the range boundary, ideally on a candle close rather than just a wick
- Volume or momentum confirming the move (a wider candle body is a simple proxy)
- The breakout direction aligned with the higher timeframe trend
The trap beginners fall into is entering the moment price touches the range boundary. Wait for a close outside it. Then, if you want a tighter entry, watch for a small pullback back toward the broken level before entering in the direction of the breakout. This is called a retest, and it improves your risk-to-reward significantly.
The Pullback Strategy
This is the setup professional traders use most often, and it is beginner-friendly once you understand structure. In an established uptrend (HH, HL sequence confirmed), you simply wait for price to pull back to a previous structure level or area of support before entering long.
The logic is clean: you are buying at a discount inside a trend, rather than chasing price at the top of a swing. Your stop loss sits below the most recent higher low, and your target is the next swing high. A 1:2 risk-to-reward ratio is realistic on most pullback setups in liquid pairs.
Practical steps for the pullback setup:
- Identify a confirmed uptrend on the four-hour chart (at least two HH and two HL)
- Wait for price to pull back toward the last HL or a key support zone
- Look for a bullish reversal candle (engulfing, pin bar, or inside bar) at that level
- Enter on the close of the confirmation candle
- Place your stop below the HL and target the previous HH
Reverse the rules for downtrends. Sell rallies into prior resistance within a LH, LL sequence.
The Reversal Setup
Reversal trading carries more risk than trend-following, but it also offers some of the highest reward-to-risk ratios available. For beginners, the safest version involves a Break of Structure (BOS) combined with a key level.
A Break of Structure happens when price violates the last significant swing high in a downtrend, or the last significant swing low in an uptrend. This signals that the dominant sequence is failing. The trade setup builds like this:
- Identify a downtrend on the daily chart
- Watch for price to take out a recent lower high (this is the BOS signal)
- Wait for a pullback after the BOS, back toward the broken level
- Enter long on a bullish confirmation candle at that level
- Stop goes below the swing low that preceded the BOS
The patience requirement here is real. You will see potential BOS signals that fail and snap back into the prior trend. Only act when the BOS is clean and the pullback gives you a defined, logical level to work with. If the level is messy, skip it.
Timeframe Alignment: Keeping It Simple
One of the fastest ways to improve consistency as a beginner is to stop trading in isolation on a single timeframe. Use a top-down approach instead.
A practical framework:
- Daily chart: determine the overall trend direction and major structure levels
- Four-hour chart: identify your setup type (breakout, pullback, or reversal)
- One-hour chart: refine entry timing and place your stop and target
If the daily chart shows a clear uptrend and the four-hour chart is pulling back to support, you have alignment. If the daily is bearish and you are trying to go long on the one-hour, you are trading against the flow and the odds tilt away from you.
Risk Management Is Not Optional
Strategy without risk management is just gambling with extra steps. Before you move forward with any of the above setups, fix these rules in place:
- Risk no more than 1% of your account per trade
- Define your stop loss before you enter, not after
- Target a minimum of 1:2 risk-to-reward on every setup
- Never move your stop loss further away from your entry to avoid being stopped out
At 1% risk per trade, you can absorb 20 consecutive losing trades and still have 80% of your capital intact. That is the kind of staying power that lets you keep learning without blowing your account.
Building Consistency Before Complexity
The temptation in 2026 is to reach for AI-assisted tools, automated signals, and multi-indicator dashboards immediately. There is a place for all of those, and for serious traders they genuinely accelerate progress. But they work best when you already understand what the tools are looking for.
Spend your first 60 to 90 days learning to read structure manually. Practice the pullback and breakout setups on a demo account, track your results in a journal, and review your trades at the end of each week. Note not just whether you won or lost, but whether you followed your rules. That habit is worth more than any indicator at this stage.
Once the patterns feel natural and your win rate on demo is consistent, you are ready to layer in more sophisticated tools and tighten your edge further. The foundation, though, always starts here.