

More Information & Purchase Links

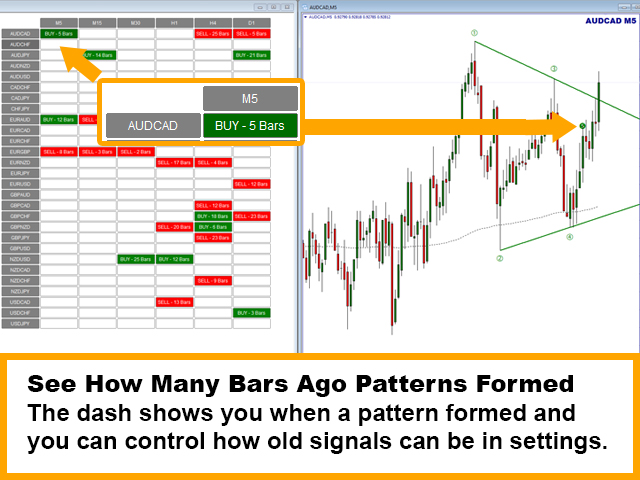
The Symmetrical Triangle Patterns Alert Dashboard
The symmetrical triangle pattern dashboard allows you to monitor multiple markets and timeframes at once for symmetrical triangle patterns as draw by the symmetrical triangle pattern indicator available here:
https://www.mql5.com/en/market/product/68709/
Visit the above indicator to learn more about how symmetrical triangle patterns are formed and simple to follow strategies to trade them.
The dashboard is a stand-alone product and DOES NOT require the indicator to work. It only monitors for the patterns and issues alerts when they form, so if you want to actually see the patterns on your charts also, you would need the symmetrical triangle pattern indicator also.
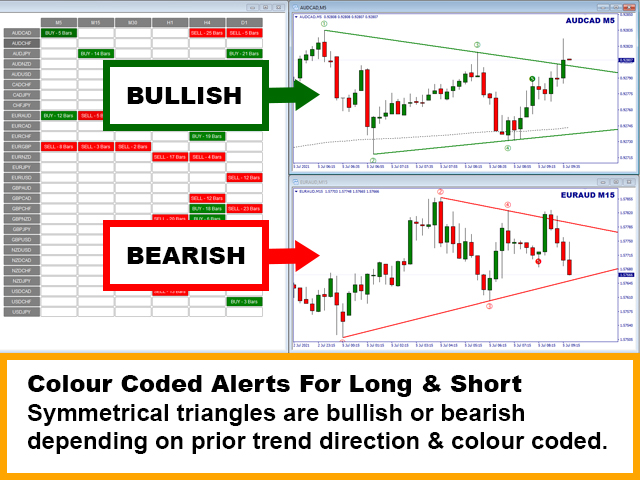
The symmetrical triangle chart pattern represents a period of contraction & consolidation before the price is forced to break out to the upside or breakdown. A breakdown from the lower trend line marks the start of a new bearish trend, while a breakout from the upper trend line indicates the start of a new bullish trend.
This dashboard identifies these patterns and alerts you when the 4 key points have formed and price has pulled back into the triangle again, so you can get ready for the potential breakout. The dashboard will monitor all major time frames and instruments you want to trade constantly for you, and check each instrument and time frame when candles close to issue alerts when new patterns form.
INPUTS AND CONFIGURATION OPTIONS:
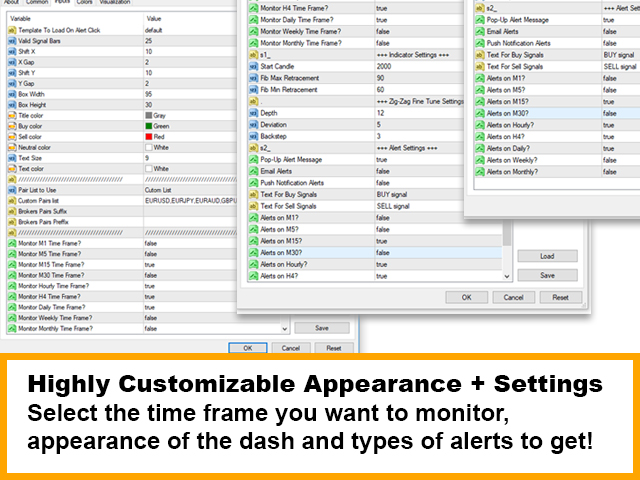
- Template Name – When you click on an alert the dash will open a new chart for that instrument and time frame, this is the name of the template it will use.
- Valid Signal Bars – The amount of candles/bars ago the dashboard will show alerts for. Defaults to not show alerts if a pattern formed more than 25 candles ago.
- Dash Visibility Settings – Shift controls the position of the dash on your chart in distance from the top and right edges, gap controls how far apart alert boxes are from each other. Box width & height controls the size of the alert boxes, and you can also control the colour of the alerts and the font size and colour.
- Pairs List – You can select to either load all instruments in your market watch or enter pairs you want to monitor manually. There is also the ability to add a prefix or suffix if your broker has that, so the pairs displayed are more readable.
- Time Frame Selection – Pick the time frames you would like to monitor. The dashboard will only display those and hide all other columns that are not in use. Choose from 1 minute to monthly time frames.
- Start Candle For Search – How many candles back the indicator will start to look for completed patterns
SETTINGS FOR SYMMETRICAL TRIANGLE INDICATOR PATTERN DETECTION - Fib Max Retracement – The maximum retracement price can make to form points 3,4 and 5
- Fib Min Retracement – The minimum retracement price can make to form points 3,4 and 5
- Zigzag Settings – Adjust the Zigzag indicator settings to fine tune to your liking. Points 1 and 2 are formed based on the standard Zigzag, which forms the start of the pattern.
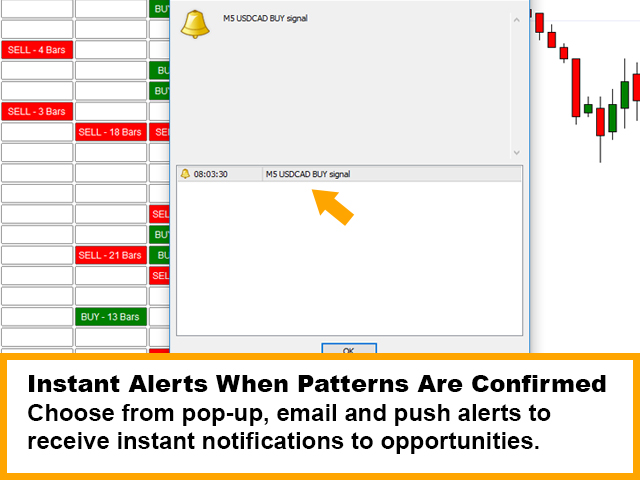
- Alerts – Choose from pop up, email or push alerts, also select which time frames you want to receive alerts for.


Join the Telegram Group
Join the Discord Server
Get The Indicators & Dashboards I use
The indicators are all available direct from your MT4 or MT5 platform in the market section. Alternatively, you can get them on the MQL5.com website!

The Market Reversal Alert Indicator
The key to the strategy is knowing when price is starting to turn and change direction. This indicator draws in market structure for you, then sends you an alert so you can take a look at your charts and see if there is a valid reason to enter a trade.

The Market Reversal Alert Dashboard
This amazing dashboard monitors the major time frames and all pairs you trade and alerts you instantly when a potential reversal happens. No more staring at charts all day! Every pair and key time frame in front of you in one MT4 window. Priceless.

The ADR Reversal Indicator
The ADR Reversal Indicator shows you at a glance where price is currently trading in relation to its normal average daily range. You will get instant alerts via pop-up, email or push when price exceeds its average range and levels above it of your choosing.

The ADR Alert Dashboard
The ADR reversal dashboard allows you to monitor every pair or instrument you trade in one dashboard. You’ll get alerted every time something exceeds your set ADR levels and ensure you will never miss an opportunity.

The Trade Manager Dashboard
Take control of your forex portfolio. See instantly where you stand, what's working and what's causing you pain! The Trade Manager Dashboard is designed to make risk management and exposure to currencies easier to understand.

The RSI and TDI Alert Dashboard
The RSI / TDI alert dashboard allows you to monitor 6 main timeframes (selectable by you) at once on every major pair you trade. The dashboard will alert you to extended conditions (overbought and oversold) when a candle closes on the chosen time frame.

Symmetrical Triangle Pattern Indicator
Profit from market contraction and consolidation after price makes new highs or lows in the market. Get alerted when a contraction is happening, ready to pounce on the next continuation or reversal move that is building up.
Symmetrical Triangle Pattern Dashboard
Get alerted and see instantly when any instrument you trade forms a symmetrical triangle pattern on any time frame. Get ready to pounce on those triangle breakouts!

Opening Range Breakout EA
Profit from the explosive moves that occur at the open of stock indices and give yourself an actionable edge every day. The opening range breakout EA can be tweaked to your liking to capture the trends that form just after the open every day on the main stock indices like the DAX, DOW, NASDAQ and S&P500.

The Market Reversal Alerts EA
Based on the indicator, this EA will auto trade signals generated from the market reversal alerts indicator. It has powerful filters to configure as you like to trade including ADR, MAs and RSI. You can also use it to basket/grid trade, and it has every risk option you can imagine.

The Price Action Toolkit EA
The missing piece of functionality in MT4!
Fast order buttons to quickly enter, adjust and exit positions and scalp with lightning speed. Get price action candlestick alerts on the most commonly traded patterns and auto execute entries and exits based on your preferences.

Support, Resistance & Propulsion Gaps
Automatically draw support and resistance levels PLUS propulsion candle gaps on your chart, so you can see where price is likely to head next and/or potentially reverse. This indicator is designed to be used as part of the position trading methodology taught on this website and displays key information for targeting and potential entries.

Stock Index Hedge EA
Take advantage of the opening volatility of the major stock indexes and profit from the sudden moves created at those times when the market breaks away at the opening bell. The strategies’ goal is to simply benefit from those days when the market moves fast and hard in one direction at the open and bank that move.