
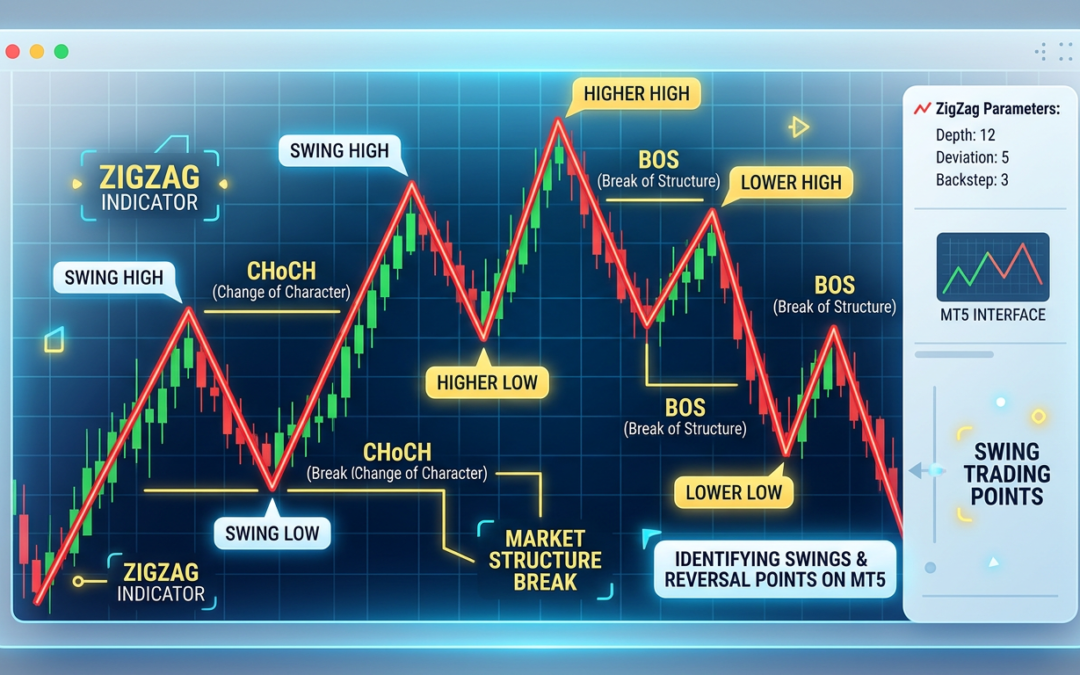
Market structure is not something you feel. It is something you read directly from price. Swing highs, swing lows, break of structure, change of character. Every one of those concepts depends on your ability to identify the right pivot points quickly and consistently. The ZigZag indicator on MT5 makes that process objective rather than discretionary.
This guide covers how to apply the ZigZag with Labels indicator to your MT5 charts, what its output actually tells you, and how to build a workable market structure read from the swing points it flags.
What the ZigZag Indicator Actually Does
At its core, ZigZag connects significant price highs and lows by filtering out minor noise below a defined threshold. The result is a series of lines that trace the dominant swings on your chart, ignoring the small back-and-forth that clutters raw candlestick data.
The ZigZag with Labels version goes a step further. It tags each identified pivot with a label, typically marking swing highs and swing lows explicitly. Instead of eyeballing whether a particular bar is a meaningful high or just a local blip, the indicator makes that call based on your chosen settings and stamps it visibly on the chart.
Some versions, particularly those built around the ICT trading approach, extend this further by identifying structural labels like Break of Structure (BOS) and Change of Character (CHoCH) at the moment price violates a prior swing. That turns ZigZag from a simple pivot finder into a genuine market structure dashboard.
Key Settings to Understand Before You Place It on a Chart
Getting useful output from ZigZag depends on calibrating its inputs correctly. The main parameters you will encounter are:
- Depth: The minimum number of bars required on each side of a pivot before it qualifies as a swing high or low. A value of 5 means the indicator needs at least 5 bars to the left and right showing lower highs or higher lows before it marks the point.
- Deviation: The minimum percentage price move required for a new swing to be drawn. Keeps small retracements from generating excessive pivots.
- Backstep: The minimum number of bars between successive ZigZag lines. Prevents the indicator from marking two pivots too close together.
For higher timeframe structure on indices like the S&P 500 or NAS100, you generally want a higher Depth value (12 to 20) so only the dominant swings appear. For intraday forex work on the 15-minute or 1-hour chart, lower values (5 to 8) keep the structure responsive without overcrowding the chart.
Reading Swing Highs and Lows for Market Structure
Once the indicator is running, your first task is simple: identify the sequence of labelled pivots and ask whether price is making higher highs and higher lows, or lower highs and lower lows.
A clean bullish structure shows each successive swing high printing above the previous one, with each pullback stopping at a higher swing low than the last. The ZigZag labels make this sequence visible at a glance without drawing anything manually. Bearish structure is the mirror: lower swing highs, lower swing lows.
Where it gets useful is when that sequence breaks. If price was printing higher highs and higher lows and then forms a lower high, you have a potential Change of Character. If the next swing then breaks below the most recent labelled swing low, that is a Break of Structure to the downside. Both events are precise, rule-based, and easy to spot when every pivot is labelled.
Using ZigZag Labels to Mark Structural Breakpoints
A structural breakpoint is simply the price level of a prior swing high or low that, if taken out, changes the narrative. ZigZag labels give you a clean library of those levels without manual mark-up.
In practice, a straightforward workflow looks like this:
- Apply the ZigZag with Labels indicator to your chosen timeframe.
- Identify the two most recent labelled swing highs and the two most recent labelled swing lows.
- Draw horizontal lines at those four levels. These are your active structural reference points.
- Watch for a candle close beyond one of those levels. A close above the most recent swing high in a downtrend signals a potential structural shift. A close below the most recent swing low in an uptrend does the same in reverse.
- Wait for a pullback into the broken level before considering an entry. The broken swing high becomes potential support; the broken swing low becomes potential resistance.
This approach keeps your analysis anchored to objective, indicator-confirmed pivots rather than hand-drawn guesses about where a swing ended.
Combining ZigZag Structure with a Higher Timeframe Bias
ZigZag labels on a single timeframe only tell part of the story. The real edge comes from aligning your lower timeframe structural signals with the direction of higher timeframe structure.
Run the indicator on the daily chart first. Note whether price is in a higher-high, higher-low sequence or the opposite. That is your directional bias. Then drop to the 4-hour or 1-hour chart and look for lower timeframe break of structure events that align with that bias. A BOS to the upside on the 1-hour, within a confirmed bullish daily structure, is a far stronger signal than the same event against the higher timeframe trend.
Multi-timeframe ZigZag analysis is simply a structured way of doing what experienced traders do instinctively: zooming out to find the dominant trend and zooming in to time the entry. The labels remove the subjectivity from that process.
What ZigZag Cannot Do
ZigZag repaints. This is a well-documented characteristic and not a flaw to overlook. The most recent swing label can shift position as new candles form and the algorithm reassesses whether the current extreme is genuinely significant. Only confirmed, historical pivots are stable.
The practical response is straightforward: never trade the most recent unconfirmed pivot. Wait for the indicator to confirm a swing by printing the next pivot in the opposite direction. At that point the previous label is locked and you can use it as a reliable structural reference.
Also, ZigZag does not tell you why a level matters, only that a pivot occurred there. Confluence with order blocks, fair value gaps, or Fibonacci levels drawn from ZigZag pivots adds the context that a raw pivot label cannot provide on its own.
Getting Started on MT5
Free versions of the ZigZag with Labels indicator are available for MT5 from several sources, including community forums and indicator repositories. When evaluating a version, check whether it includes explicit BOS and CHoCH labels rather than just swing high and swing low markers. The structural labels save significant manual analysis time.
To install, download the .ex5 or .mq5 file, place it in your MT5 Indicators folder under MQL5/Indicators, restart the platform, and locate it in the Navigator panel under Custom Indicators. Apply it to a chart, set your Depth and Deviation values based on the timeframe, and begin building your structural read from the labelled pivots it generates.
Market structure analysis is not complicated in principle. The challenge is doing it consistently and without bias. ZigZag with Labels handles the mechanical identification so you can focus on the decisions that actually matter.