
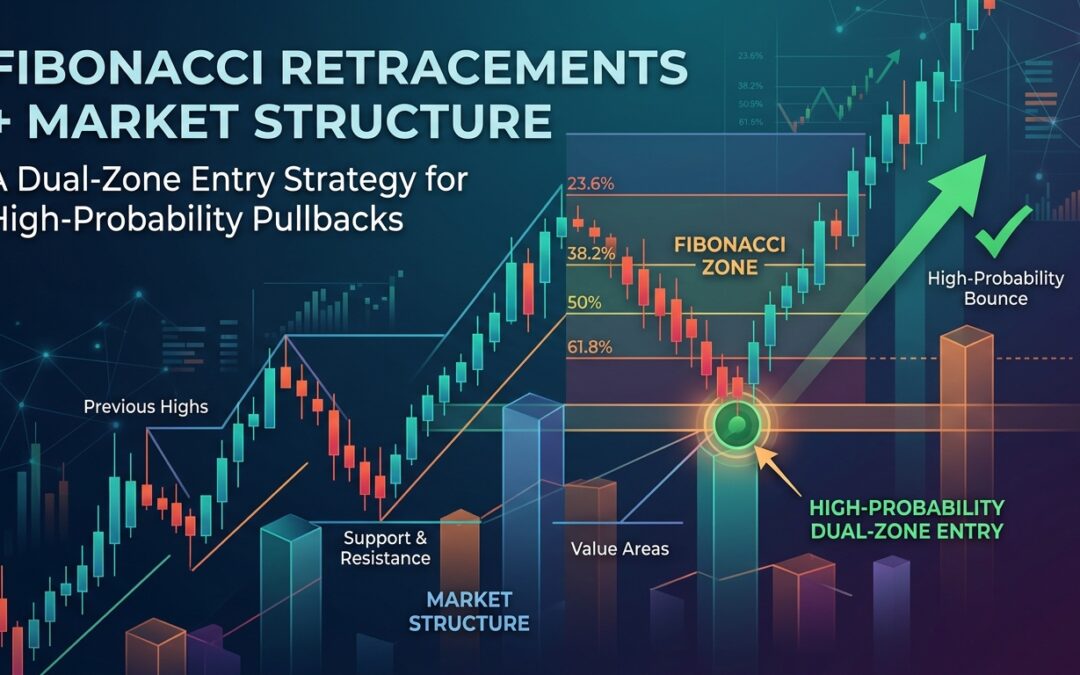
Most traders draw one Fibonacci retracement and hope price respects the 61.8%. That works sometimes. But stacking two separate Fibonacci measurements over the same price area, and aligning those levels with established market structure, gives you something far more reliable: a zone where multiple technical factors converge and traders are forced to react.
This article walks through exactly how to build that kind of setup on forex pairs and stock indices, using two Fibonacci retracements alongside structural support and resistance to find entries with genuine edge.
Why Two Fibonacci Measurements Instead of One
A single Fibonacci retracement draws levels from one swing high to one swing low. The problem is that price often ignores individual levels entirely. The 38.2% gets skipped, the 50% holds briefly then fails, and by the time price reaches the 61.8%, you have no real confirmation it will hold either.
When you apply a second Fibonacci measurement from a different swing, you introduce a second set of levels across the same price area. Where levels from both measurements cluster together, say the 61.8% of the first swing lands within a few pips of the 38.2% of the second swing, you now have a dual-Fibonacci confluence zone. Price tends to react at these zones because more traders are watching the same level from different vantage points.
The goal is simple: find at least two Fibonacci levels from separate swings overlapping in the same area. That overlap becomes your zone of interest, not a single line.
Adding Market Structure to the Mix
Fibonacci levels floating in a vacuum are noise. Fibonacci levels sitting inside an established structural zone are signal. Market structure gives you context: is this area where price has previously reversed? Has it acted as support or resistance multiple times? Is there a prior swing high or low, a consolidation range, or a broken level that has now flipped?
The strongest setups align your dual-Fibonacci confluence zone with one or more of the following structural factors:
- A prior swing high or low that price is pulling back into
- A broken resistance level that has flipped to support (or vice versa)
- A fair value gap or imbalance area sitting within the zone
- A higher-timeframe demand or supply zone
When all of these overlap, you are not guessing at a Fibonacci level. You are identifying a price area where structural logic and mathematical confluence point to the same conclusion. That is where participation concentrates.
How to Build the Setup Step by Step
Start on a higher timeframe, the daily or four-hour chart, and identify the prevailing trend direction. You are looking to trade pullbacks in the direction of that trend, not counter-trend entries.
Once you have a clear impulse move, apply your first Fibonacci retracement from the most recent significant swing low to swing high (in an uptrend). Then identify a second relevant swing, this could be a shorter-term impulse leg within the same trend, or the prior swing that preceded the main move, and draw a second Fibonacci retracement over that range.
Look at where the levels stack. Common cluster combinations worth watching include:
- The 61.8% of the larger swing aligning with the 38.2% of the smaller swing
- The 50% of both swings landing within the same 10-15 pip range on forex
- The 78.6% of a shorter swing coinciding with the 61.8% of a longer one
Mark that cluster zone on your chart. Then zoom out and check whether it sits inside or near a structural zone. If it does, you have a candidate area for entry.
Entry Triggers and Confirmation
Identifying the zone is only half the work. You still need a trigger to enter, because price can slice through even well-defined confluence areas on momentum. Do not step in just because price touches your zone.
On the lower timeframe (the one-hour or 15-minute chart), watch for a specific price action signal as price approaches the zone. Reliable triggers include:
- A bullish engulfing candle closing above the open of the previous bearish candle, within the zone
- A pin bar or hammer with the wick testing into the zone and the body closing above it
- A break of a short-term lower high on the lower timeframe, confirming the pullback is ending
- A change of character on the lower timeframe, where the market starts printing higher lows inside the zone
One additional filter worth using is a 200-period moving average on the entry timeframe. If price is pulling back into your confluence zone and the 200 MA is also pointing in the direction of the trade, the probability of follow-through improves. This is not a required filter, but it removes entries where the trend is genuinely uncertain.
Stop Placement and Target Logic
Stop loss placement should respect the structure of the zone, not arbitrary pip counts. In a long setup, place your stop below the lowest point of the confluence zone, giving it a small buffer to account for wicks. If the structure below the zone is very clean (a clear prior swing low), you can use that as your stop anchor.
For targets, Fibonacci extensions from the same swings you used for the retracements give you natural profit objectives. The 127.2% and 161.8% extensions of the corrective swing are common first and second targets. Plot these before you enter so your risk-to-reward ratio is clear from the start. A minimum of 1:2 risk-to-reward is the baseline for these setups; the structure usually supports 1:3 or better when the confluence is genuinely strong.
Applying This on MT4 and MT5
Both MT4 and MT5 include the Fibonacci retracement tool natively. Drawing two separate Fibonacci objects on the same chart is straightforward: apply the first from your main swing, then apply a second instance from the secondary swing. Use different colours to keep them visually distinct.
If you want to automate the identification of these zones, a market structure indicator that marks swing highs, swing lows, and structural zones removes the manual scanning work. Pair that with the dual Fibonacci overlay and you have a clean workflow: the indicator surfaces the structural context, the Fibonacci tools identify the precise entry zone.
The edge in this approach is not complexity. It is patience. Most trading days, no setup forms. When one does, and the confluence is genuine, the trade tends to move cleanly. That is the point.