
Index Statistics and Session Level Analysis Indicator (I.S.S.L.A.)
Stop Guessing. Start Trading with a Statistical Edge.
Stock indices don’t trade like forex. They have defined sessions, they gap overnight, and they follow predictable statistical patterns. This indicator gives you the probability data you need to trade indices like the DAX, S&P 500, and Dow Jones with confidence.

More Information & Purchase Links
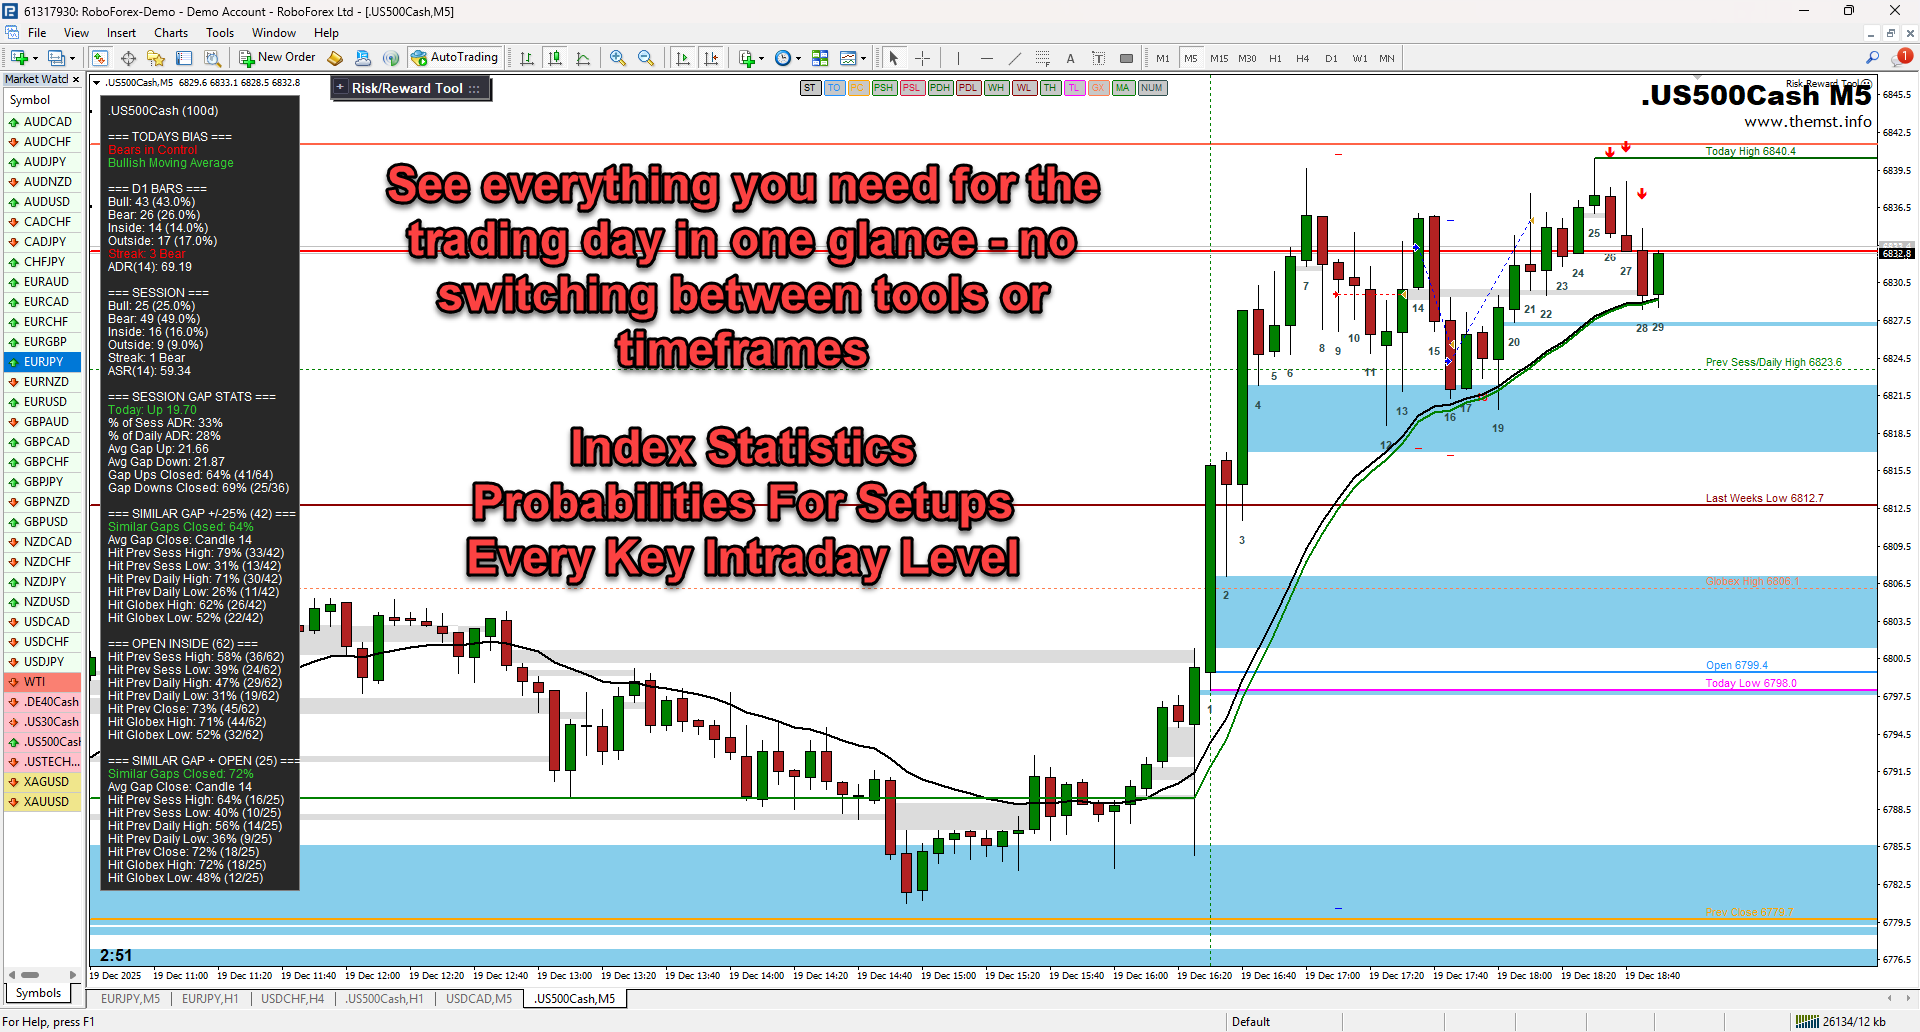
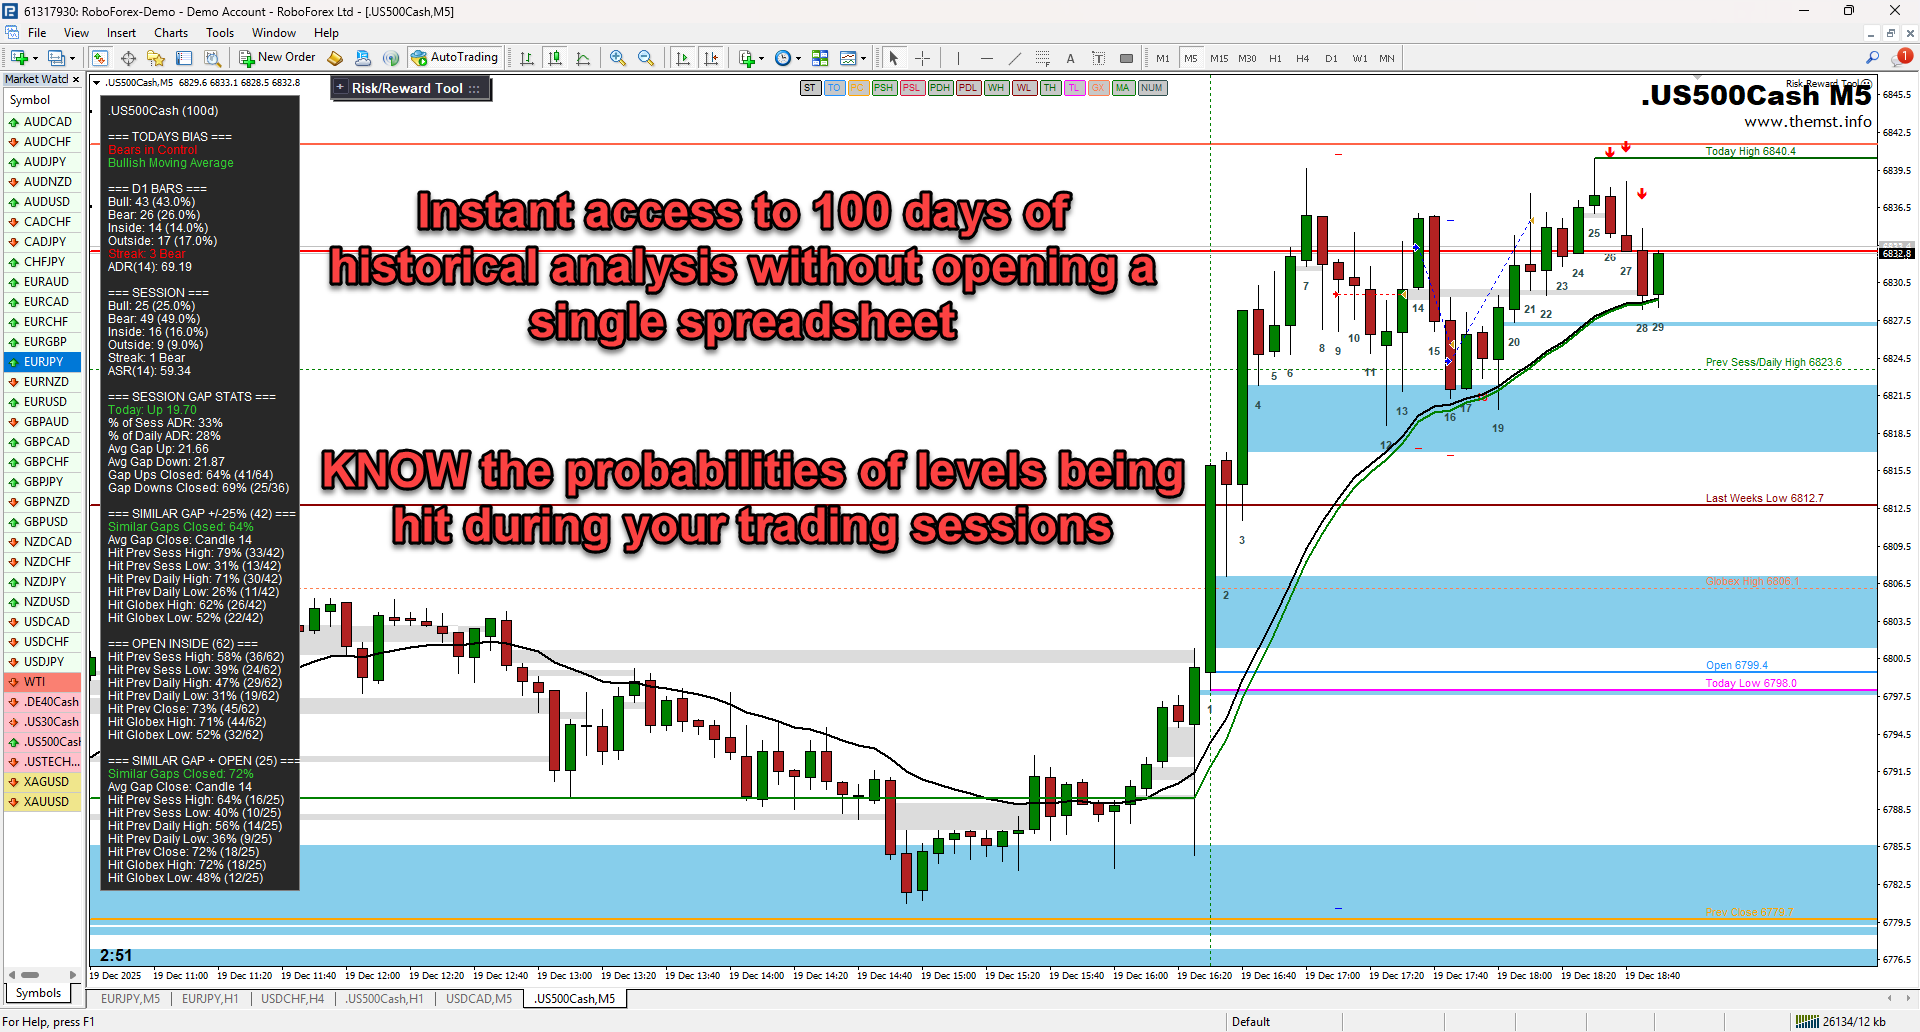
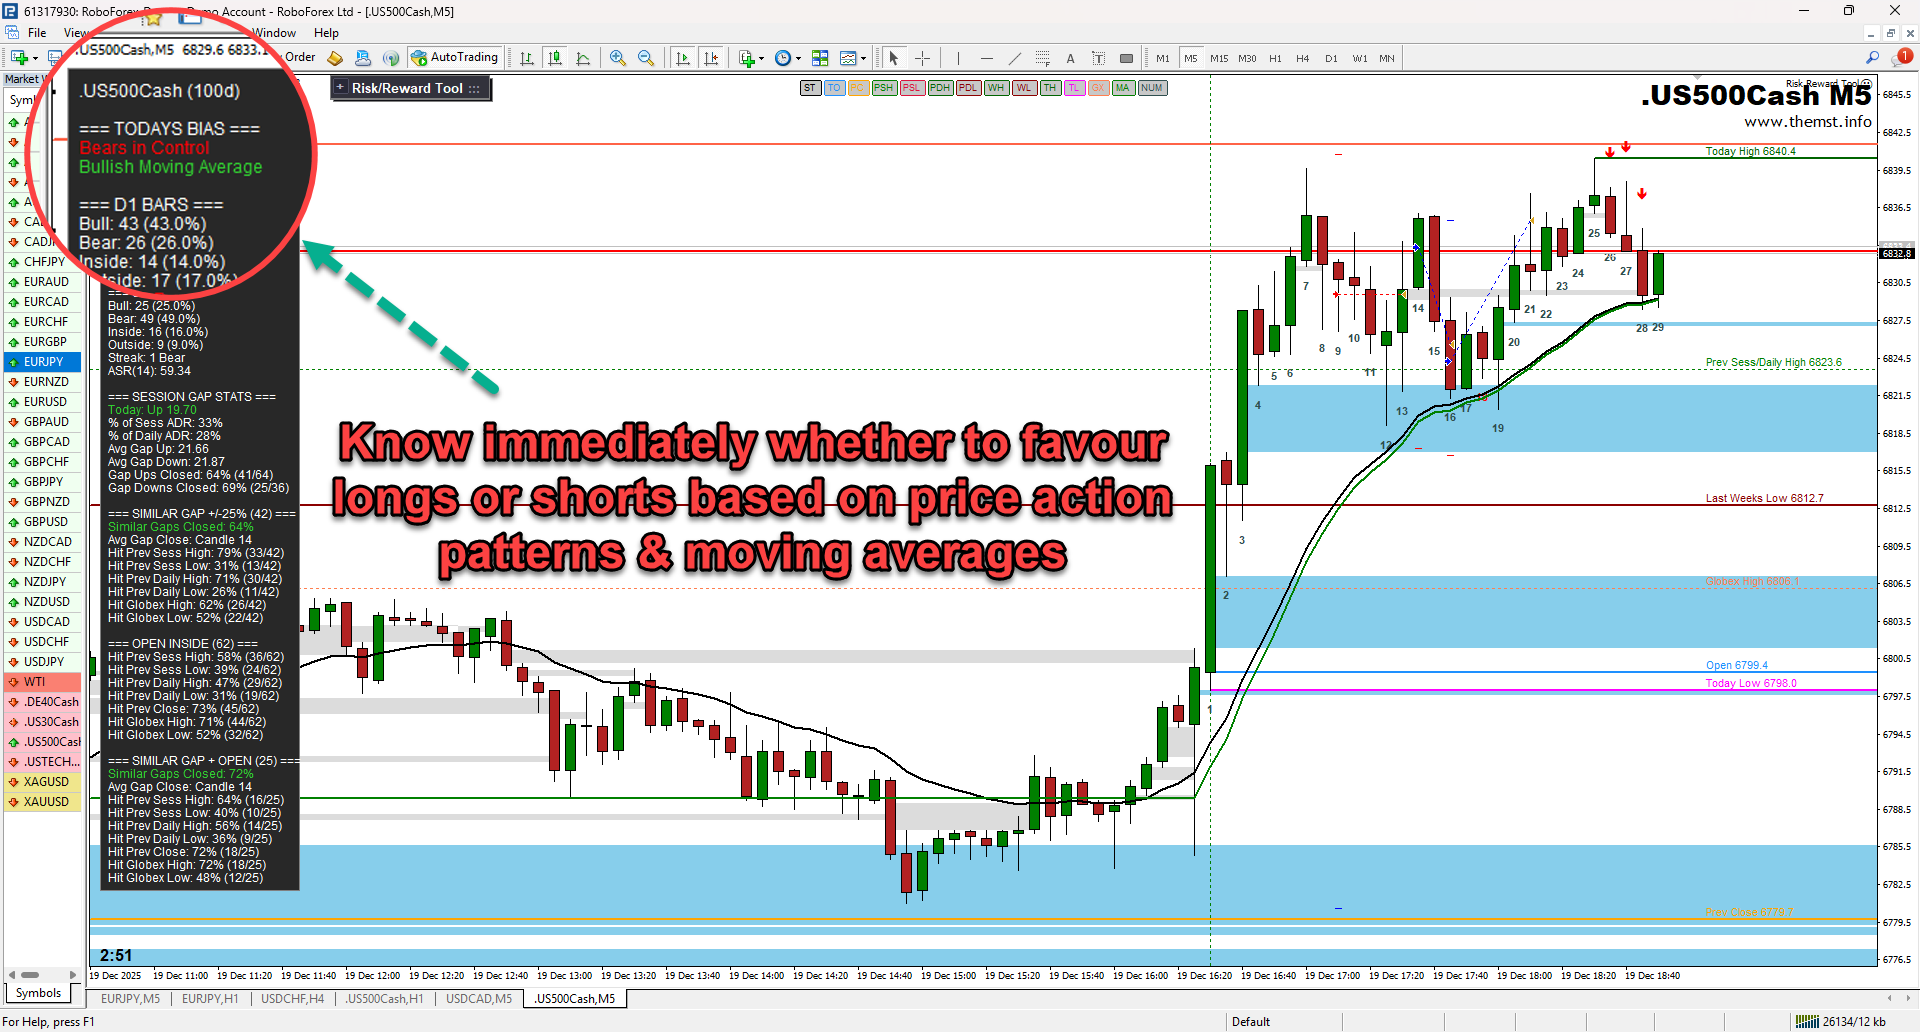
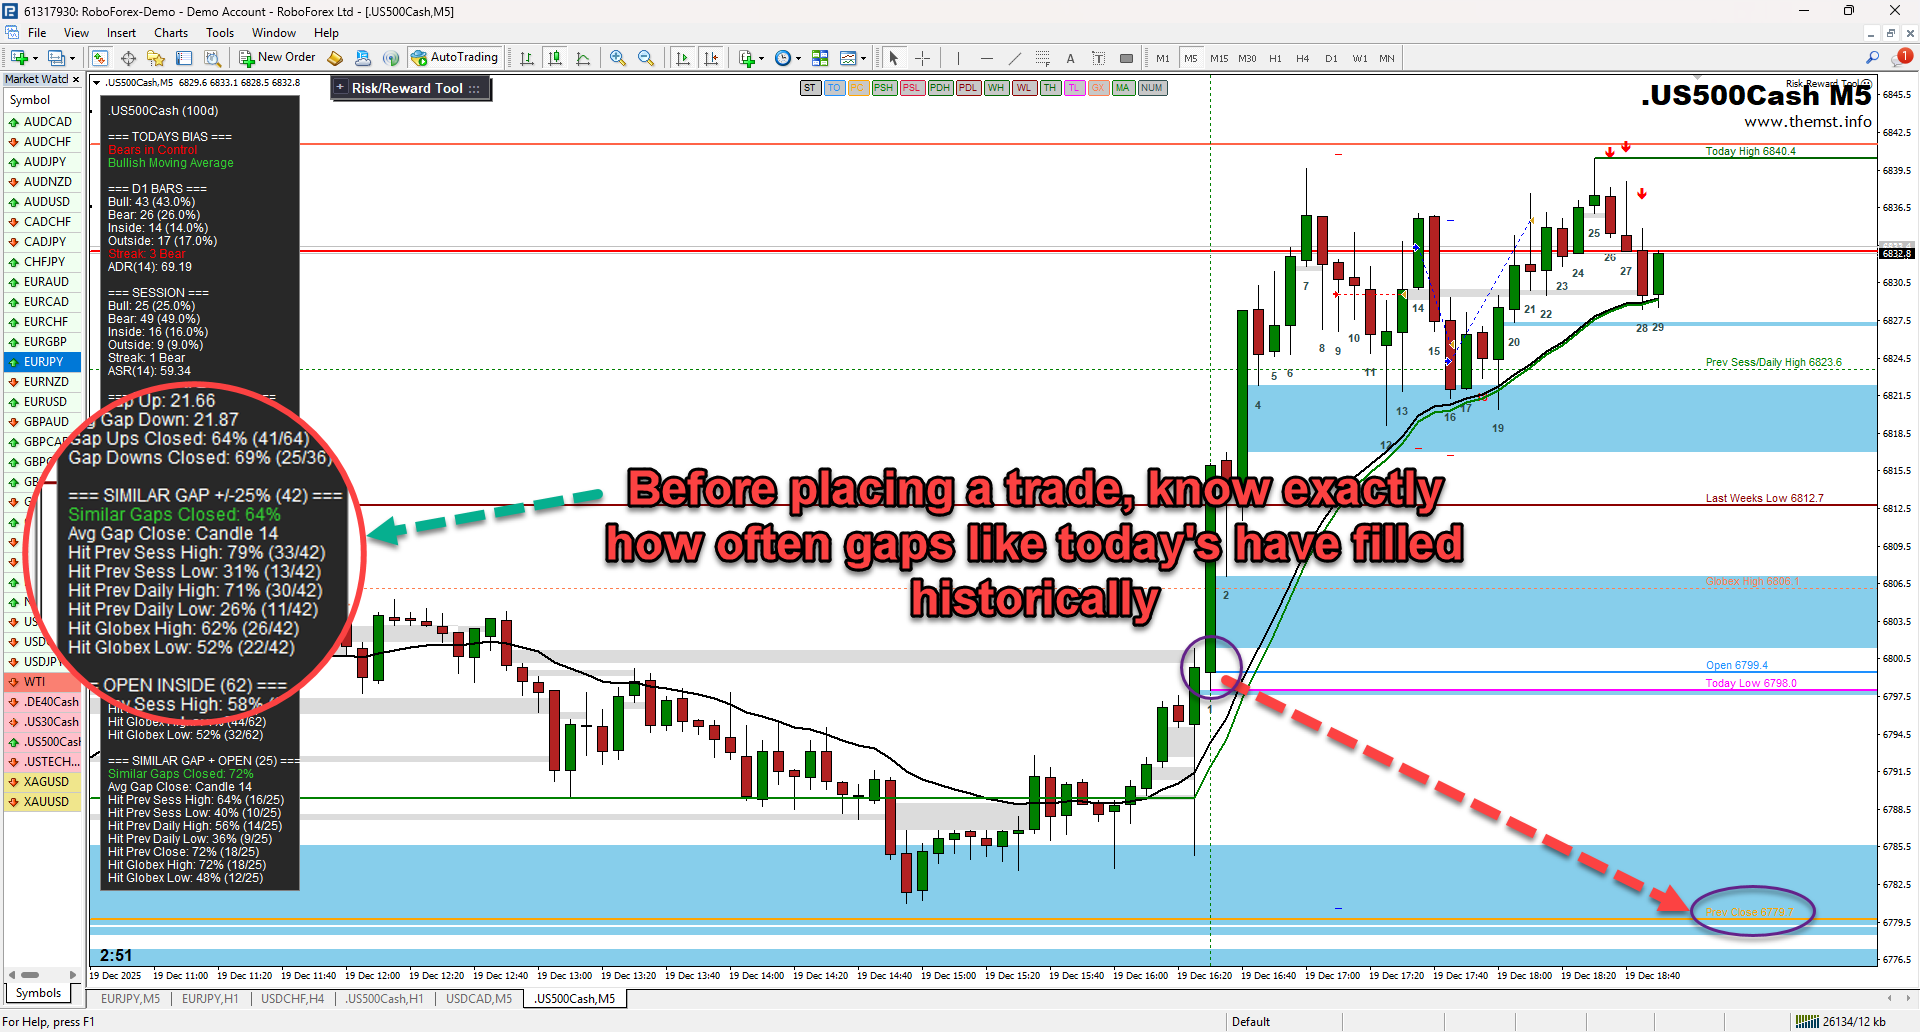
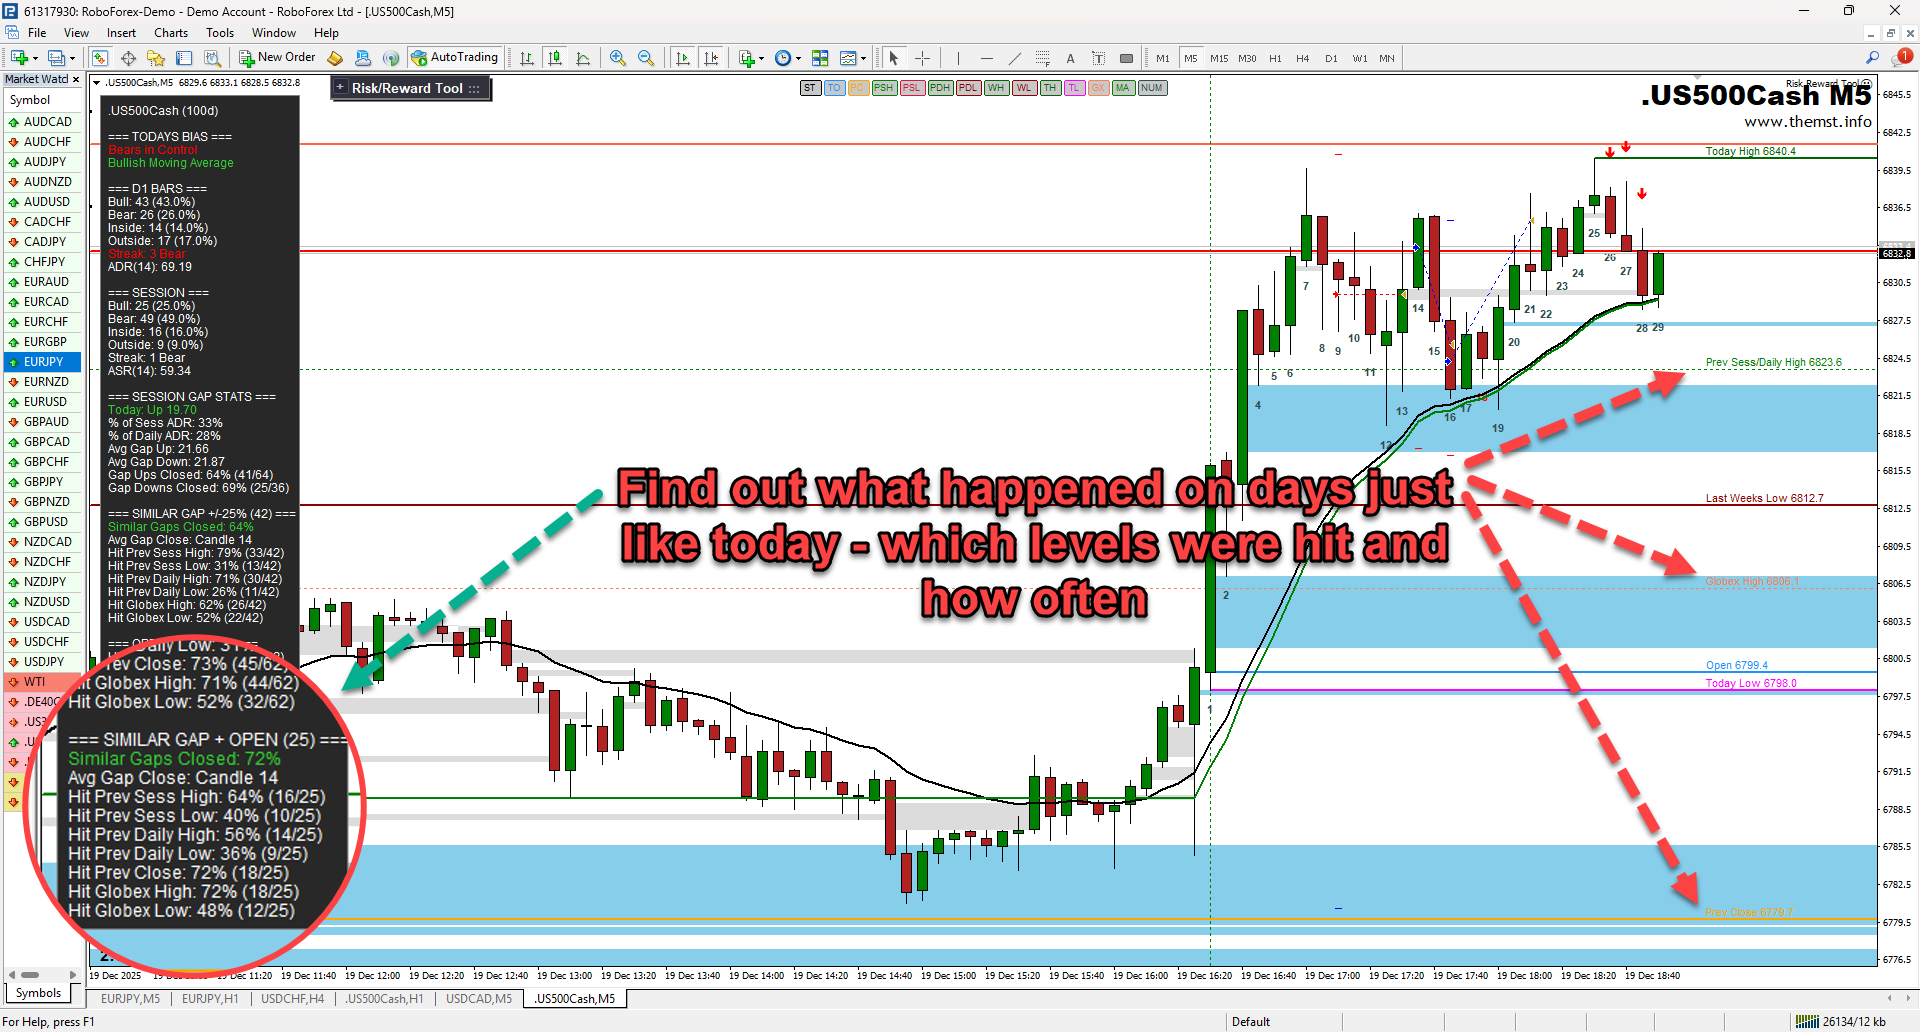
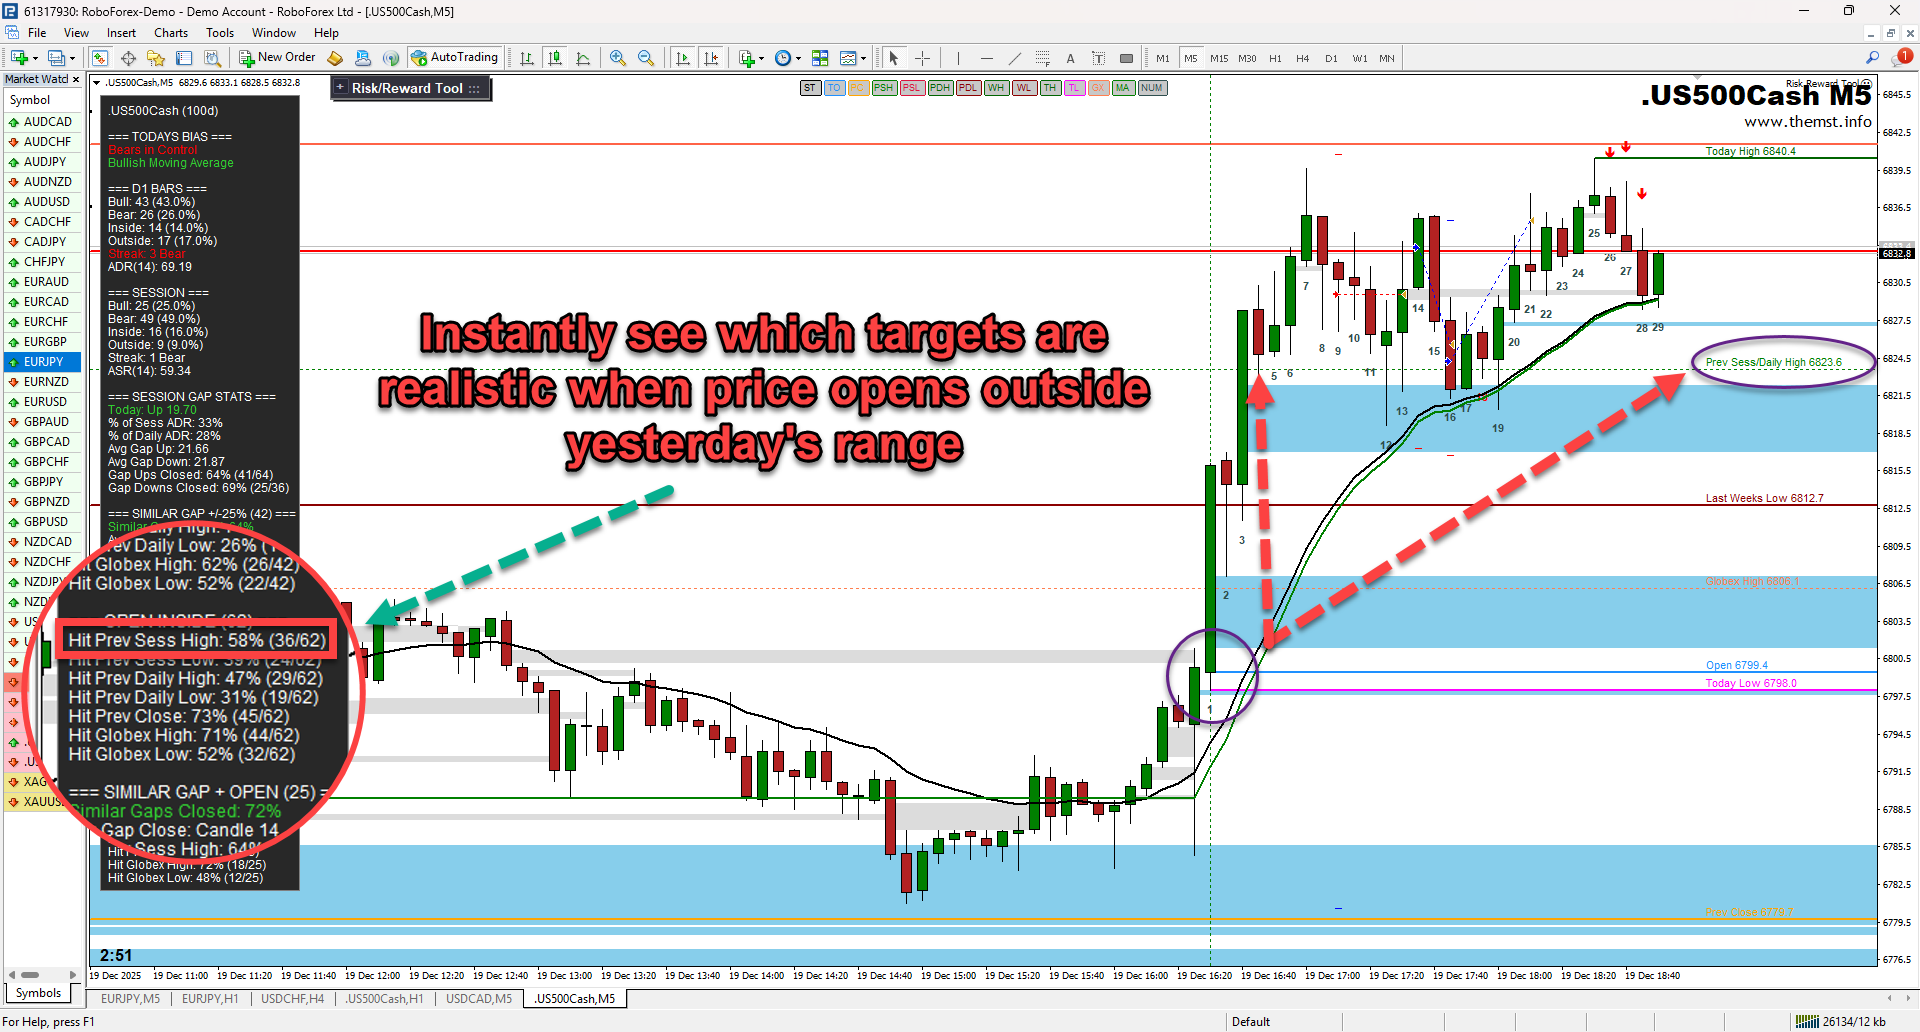
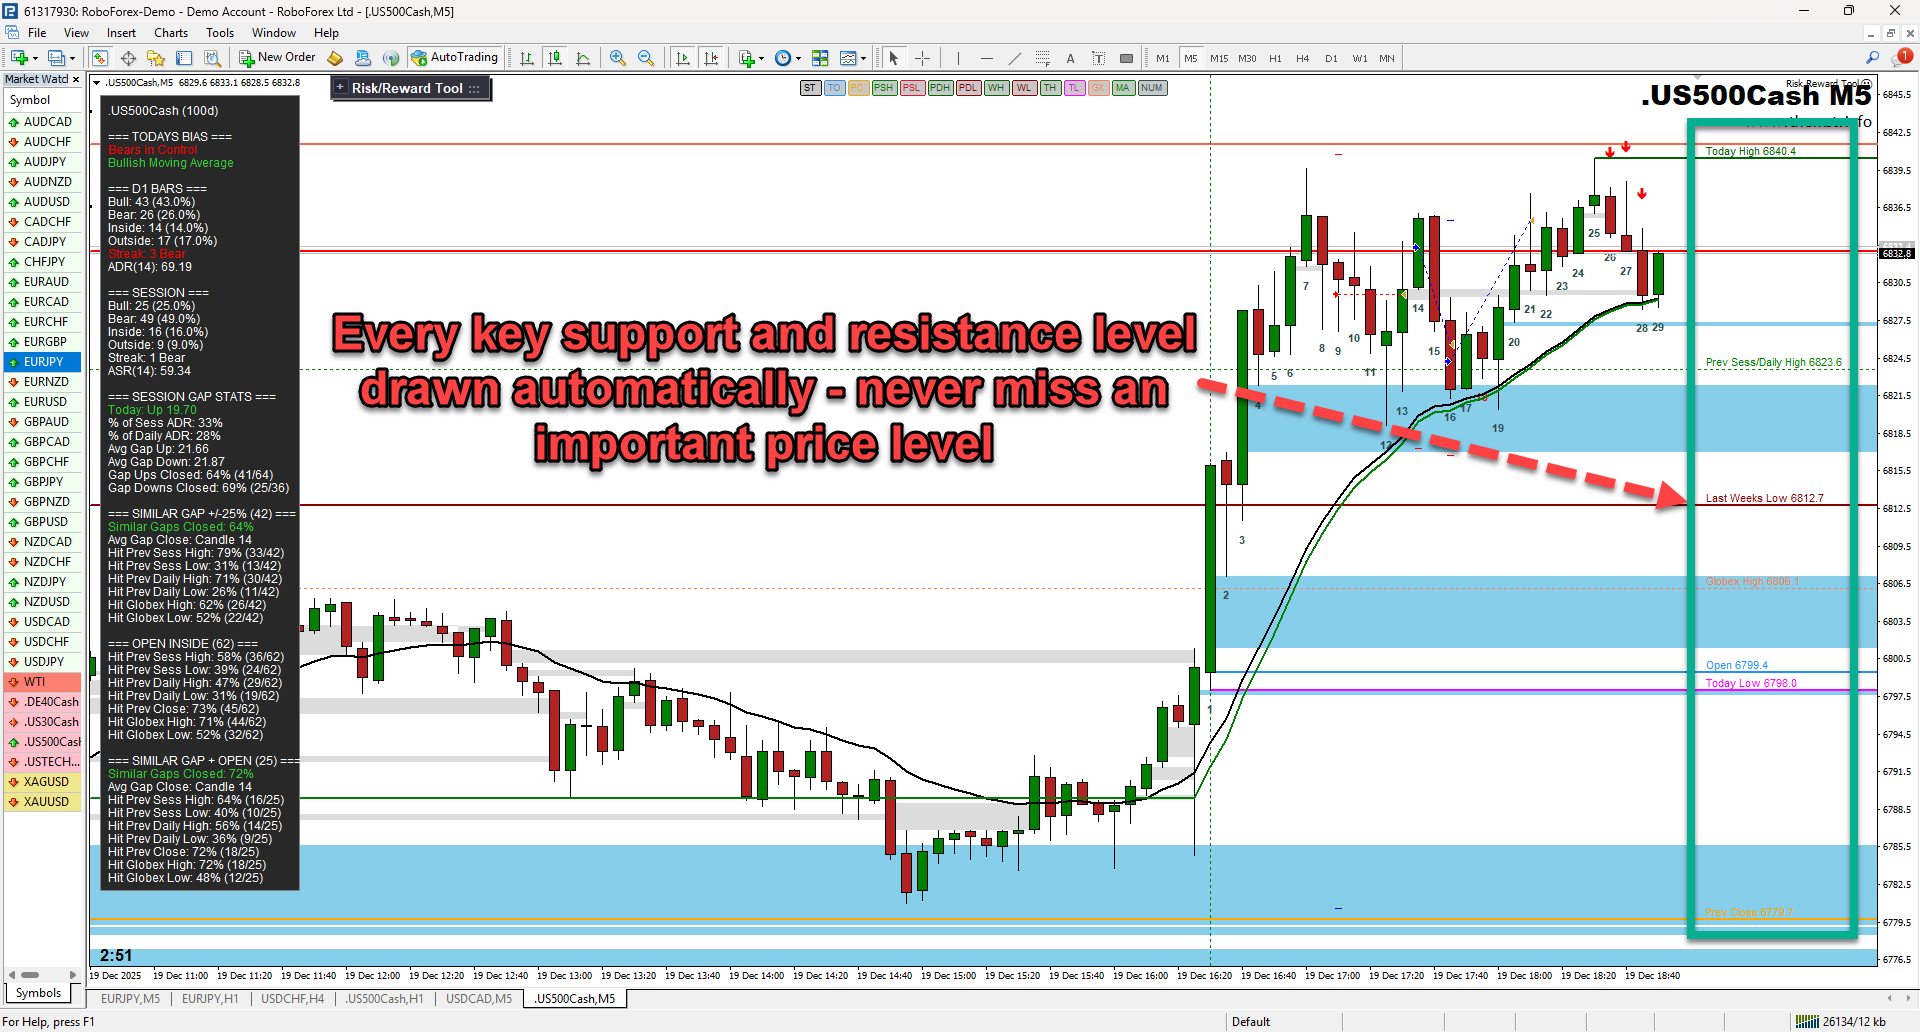
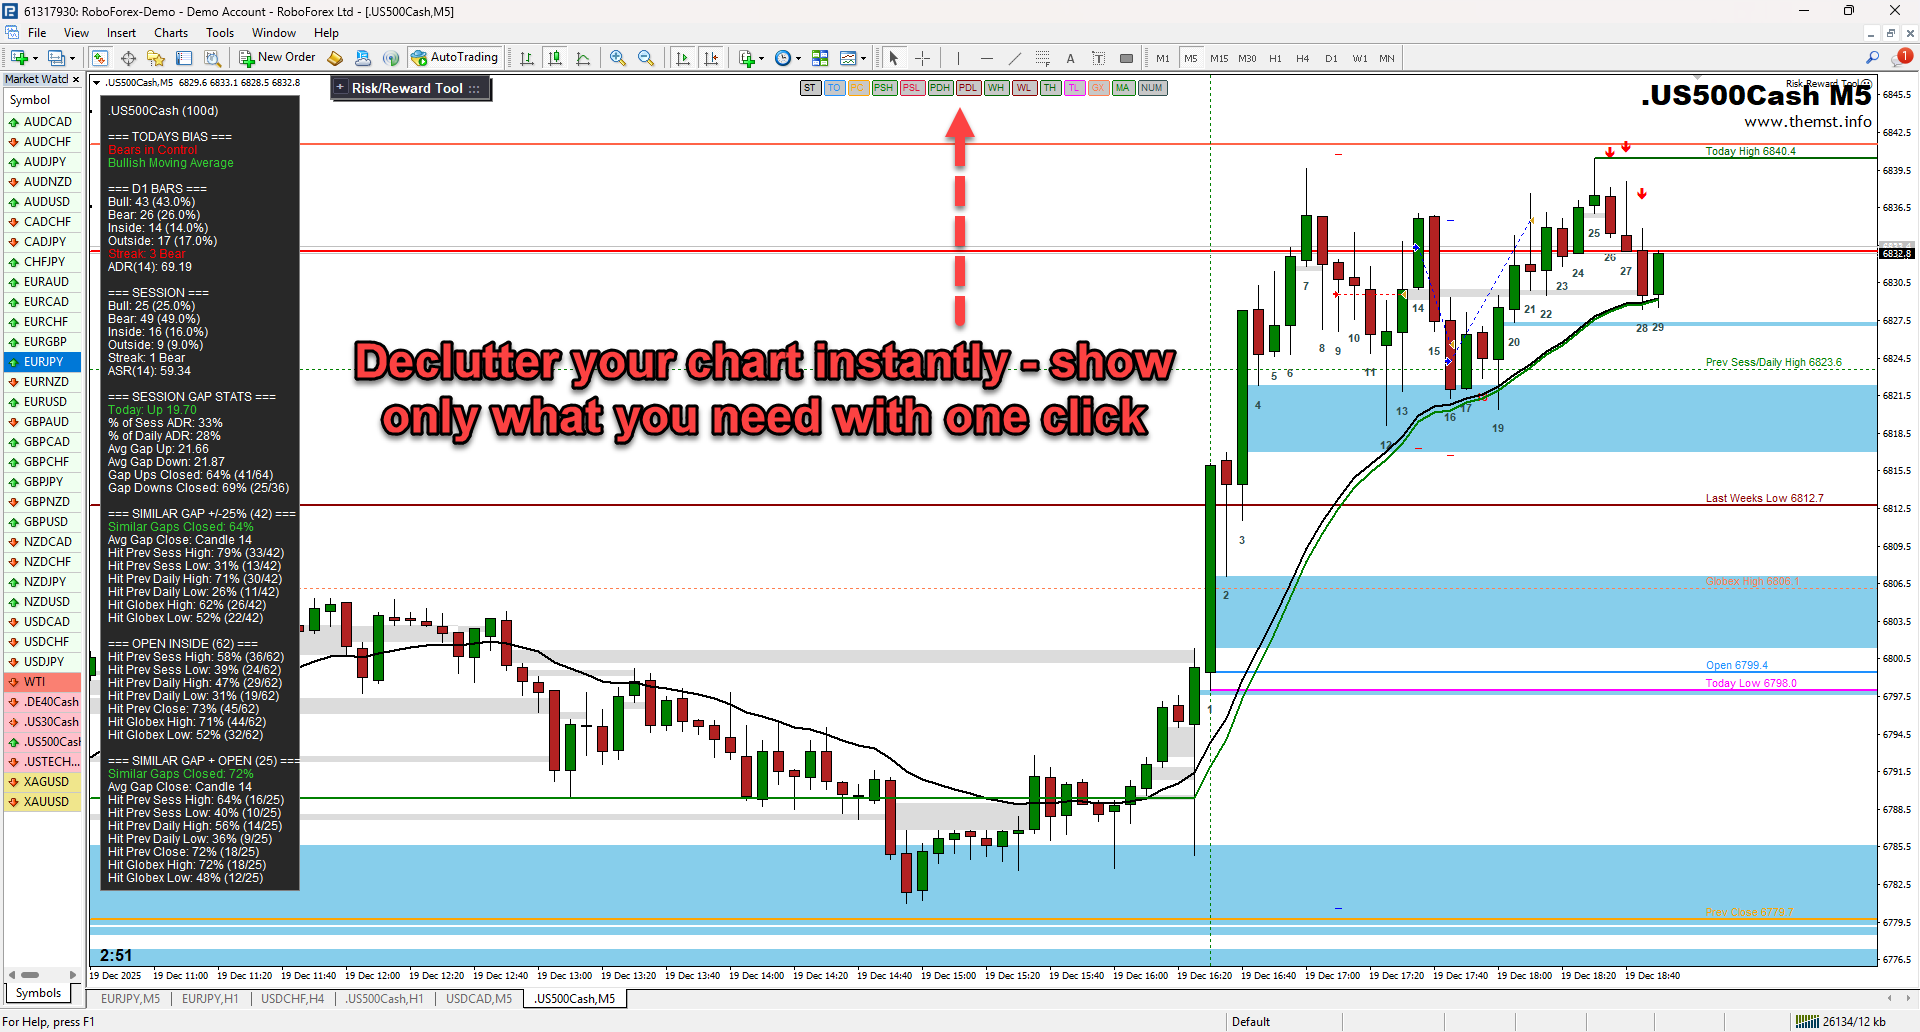
Index Statistics and Session Level Analysis Indicator (I.S.S.L.A.)
What Makes This Different
Most indicators show you what happened. This one shows you what’s likely to happen next. Every trading day, the indicator analyses your current setup against 100 days of historical data. It finds days with similar gaps, similar opening positions, and calculates exactly how often price reached key levels. No more guessing whether the gap will fill or if yesterday’s high will be tested. You get hard percentages based on real data.
Key Features
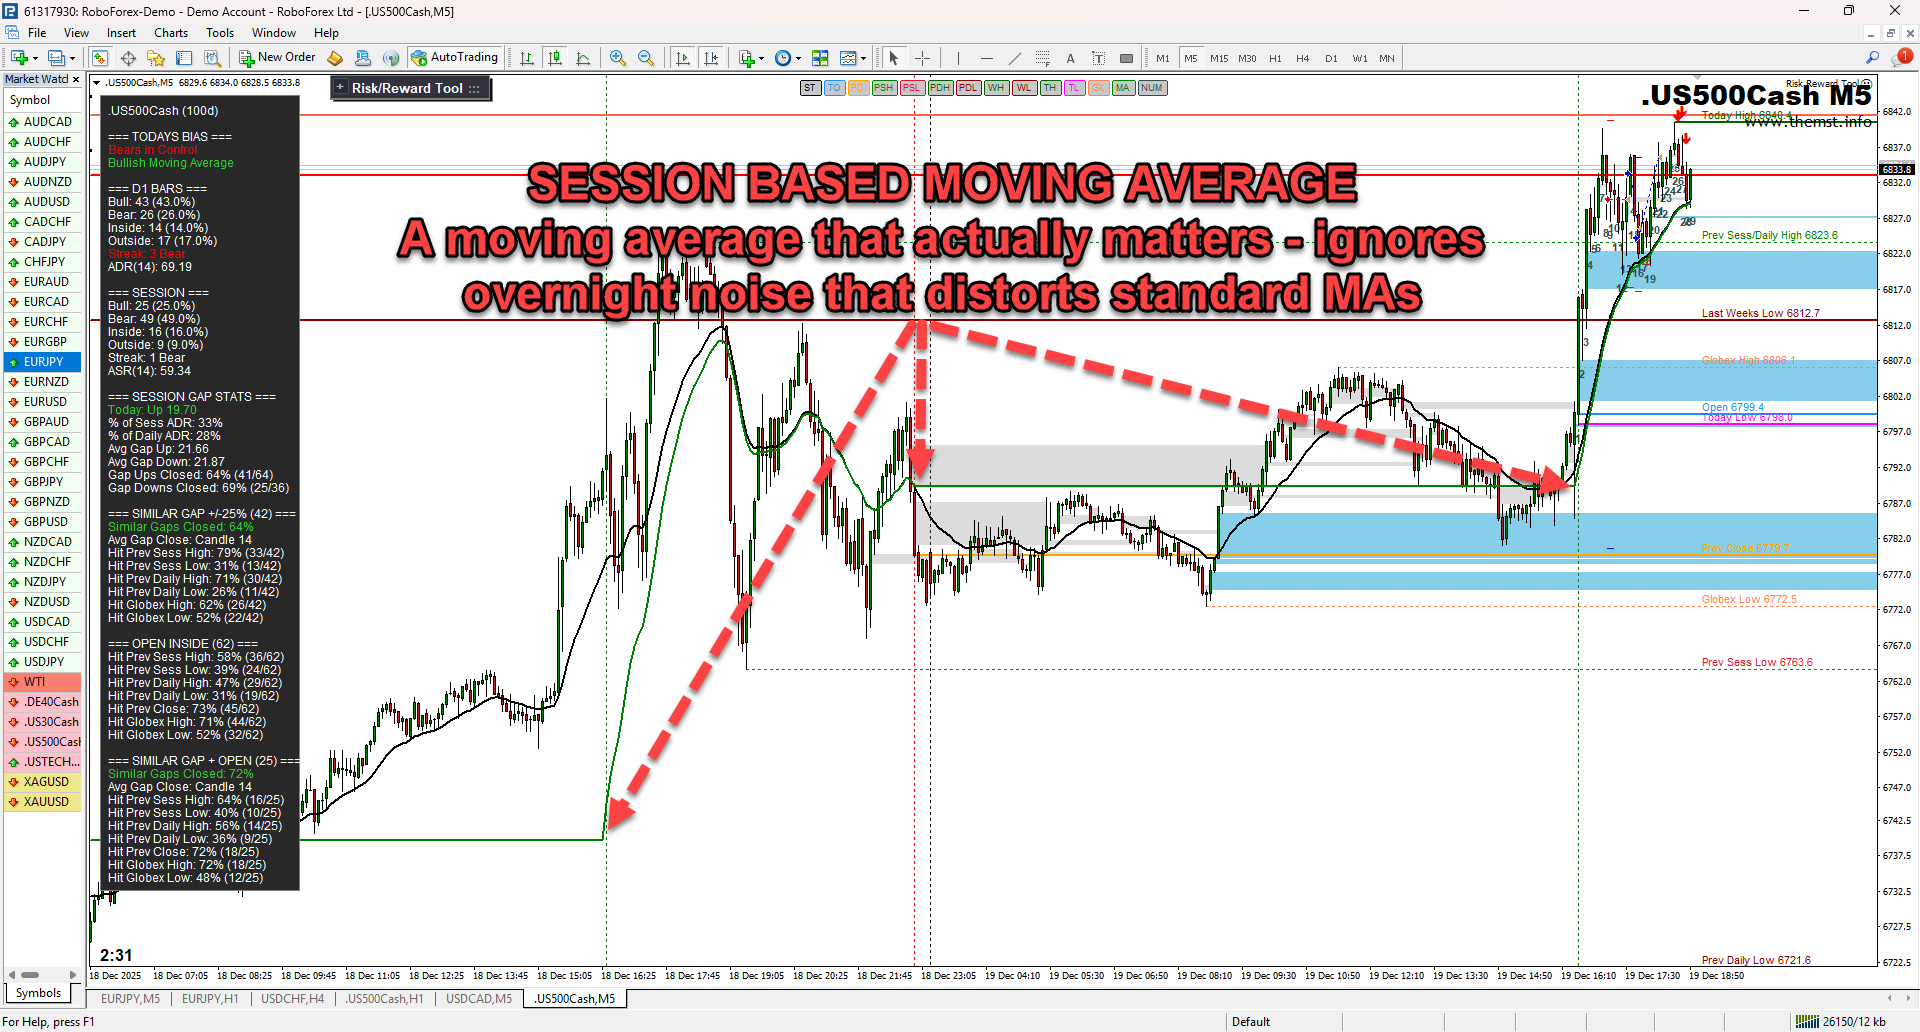
- Session-filtered calculations that ignore overnight noise.
- Automatic detection of bullish or bearish control.
- Gap analysis showing historical fill rates. Pattern matching that finds statistically similar days. Probability percentages for hitting previous session highs, lows, daily levels, and weekly levels.
- All key price levels drawn automatically with one-click toggle buttons.
How Traders Use It
A gap down opens 15% of average daily range below yesterday’s close. The indicator shows that 82% of similar gaps closed during the session, typically by candle 8. You buy near the open, targeting the gap fill, and take profits within the first hour.
Price opens below yesterday’s session range. Historical data shows 0% of similar days ever reached yesterday’s high. You avoid holding longs expecting new highs and instead focus on downside targets where the probability favours you.
The indicator detects Bears in Control after three consecutive strong bearish closes. Combined with price below the session moving average, you have confirmation to hold short positions and sell rallies.
Built for Serious Index Traders
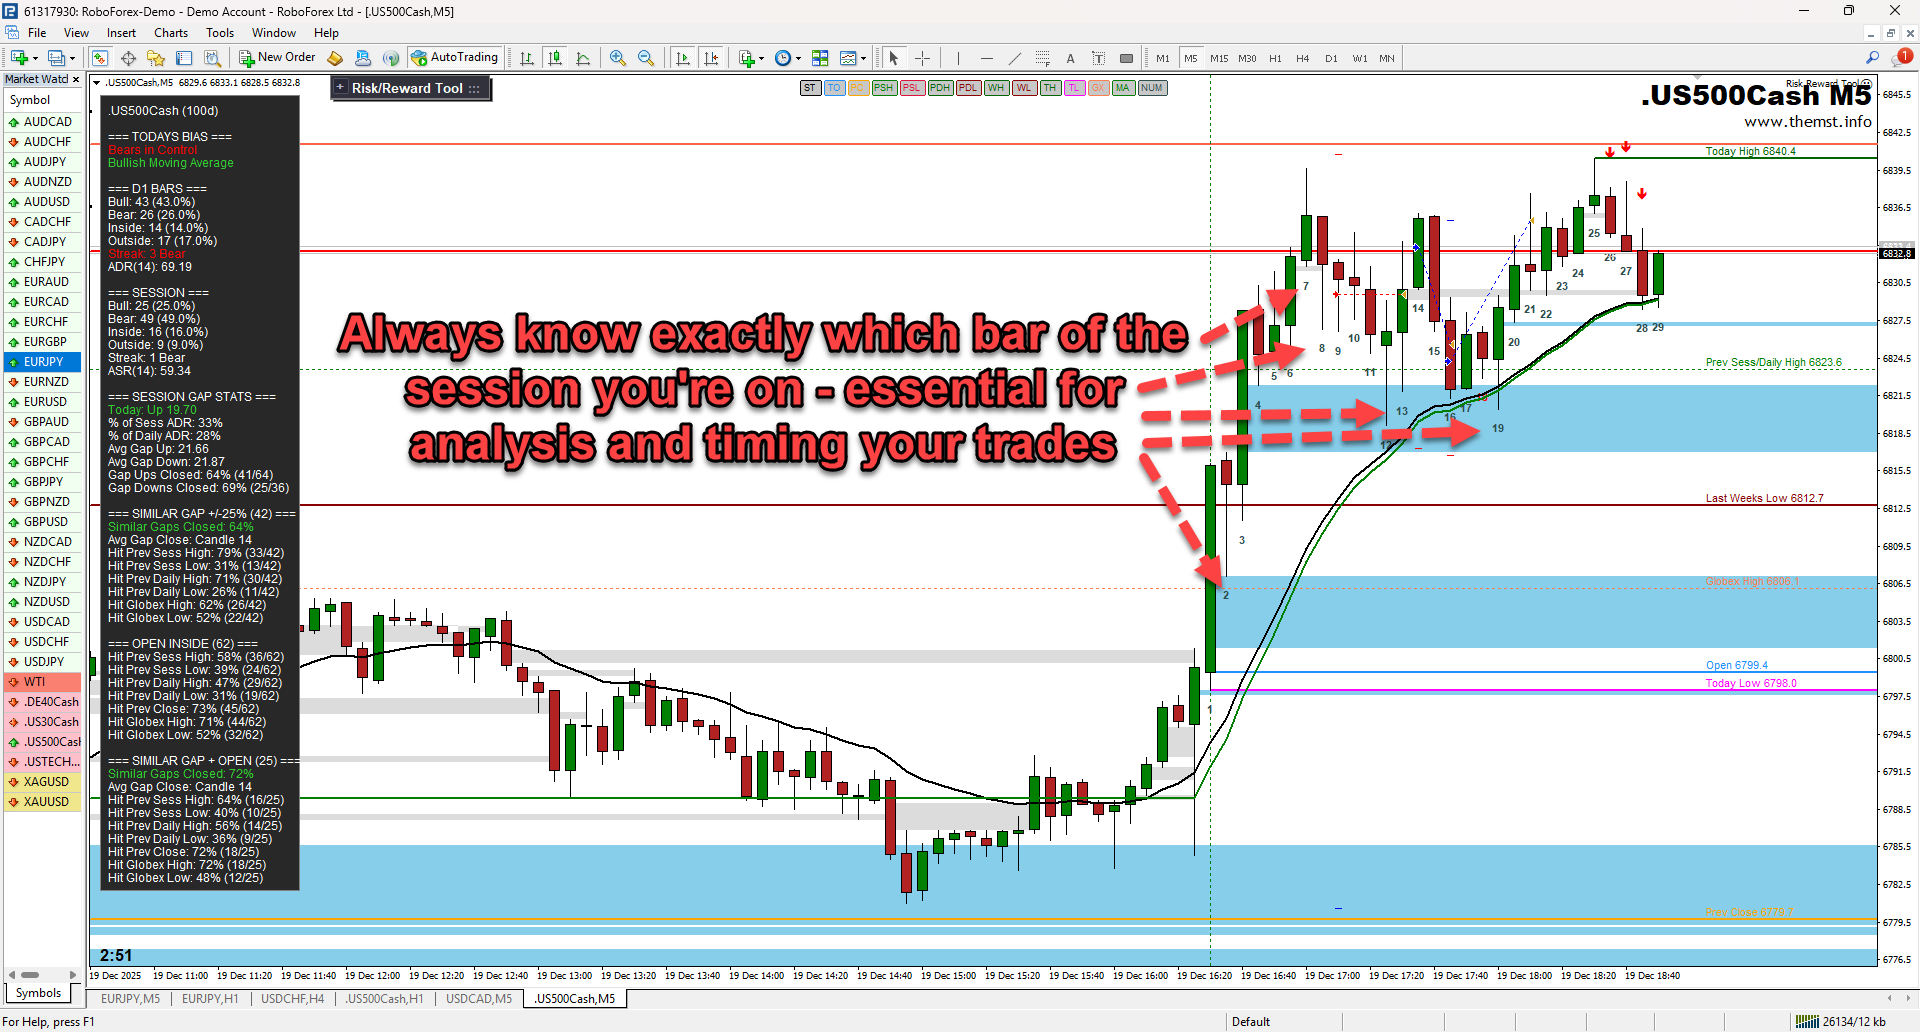
Fourteen toggle buttons let you show or hide any element instantly. The statistics panel auto-sizes based on content. Candles are numbered from session open so you always know where you are in the day. Bar 18 is highlighted because statistically, 80% of the daily range is established by that point.
Strategy Tester integration captures screenshots at every session close with intelligent filenames describing each day’s pattern, perfect for building your own statistical edge through visual backtesting.
Trade Smarter
When you know that 75% of days matching your current setup hit the previous daily low, you trade differently. When you know only 17% reached the previous close, you set realistic targets. This indicator transforms how you approach each trading day by replacing hunches with probabilities.
Works best on M5 timeframe. Optimised for DAX, S&P 500, Dow Jones, Nasdaq, and FTSE 100.
Perfect For Al Brooks Reading Price Action Students
Incorporated into the indicator is a candle numbering system that follows the same methodology taught by Al Brooks along with all the extra statistical data to help you read price action like a professional. It also has a multi bar run logic which will help you identify whether the bulls or bears are in control of the market. Multiple candles in a row the same colour? Wait for a pullback against that direction and jump on the trend. Fully configurable to your liking with candle strength and number of consecutive candles inputs.


Join the Telegram Group
Join the Discord Server
Get The Indicators & Dashboards I use
The indicators are all available direct from your MT4 or MT5 platform in the market section. Alternatively, you can get them on the MQL5.com website!

The Market Reversal Alert Indicator
The key to the strategy is knowing when price is starting to turn and change direction. This indicator draws in market structure for you, then sends you an alert so you can take a look at your charts and see if there is a valid reason to enter a trade.

The Market Reversal Alert Dashboard
This amazing dashboard monitors the major time frames and all pairs you trade and alerts you instantly when a potential reversal happens. No more staring at charts all day! Every pair and key time frame in front of you in one MT4 window. Priceless.

The ADR Reversal Indicator
The ADR Reversal Indicator shows you at a glance where price is currently trading in relation to its normal average daily range. You will get instant alerts via pop-up, email or push when price exceeds its average range and levels above it of your choosing.

The ADR Alert Dashboard
The ADR reversal dashboard allows you to monitor every pair or instrument you trade in one dashboard. You’ll get alerted every time something exceeds your set ADR levels and ensure you will never miss an opportunity.

The Trade Manager Dashboard
Take control of your forex portfolio. See instantly where you stand, what's working and what's causing you pain! The Trade Manager Dashboard is designed to make risk management and exposure to currencies easier to understand.

The RSI and TDI Alert Dashboard
The RSI / TDI alert dashboard allows you to monitor 6 main timeframes (selectable by you) at once on every major pair you trade. The dashboard will alert you to extended conditions (overbought and oversold) when a candle closes on the chosen time frame.

Symmetrical Triangle Pattern Indicator
Profit from market contraction and consolidation after price makes new highs or lows in the market. Get alerted when a contraction is happening, ready to pounce on the next continuation or reversal move that is building up.

Symmetrical Triangle Pattern Dashboard
Get alerted and see instantly when any instrument you trade forms a symmetrical triangle pattern on any time frame. Get ready to pounce on those triangle breakouts!

Opening Range Breakout EA
Profit from the explosive moves that occur at the open of stock indices and give yourself an actionable edge every day. The opening range breakout EA can be tweaked to your liking to capture the trends that form just after the open every day on the main stock indices like the DAX, DOW, NASDAQ and S&P500.

The Market Reversal Alerts EA
Based on the indicator, this EA will auto trade signals generated from the market reversal alerts indicator. It has powerful filters to configure as you like to trade including ADR, MAs and RSI. You can also use it to basket/grid trade, and it has every risk option you can imagine.

The Price Action Toolkit EA
The missing piece of functionality in MT4!
Fast order buttons to quickly enter, adjust and exit positions and scalp with lightning speed. Get price action candlestick alerts on the most commonly traded patterns and auto execute entries and exits based on your preferences.

Support, Resistance & Propulsion Gaps
Automatically draw support and resistance levels PLUS propulsion candle gaps on your chart, so you can see where price is likely to head next and/or potentially reverse. This indicator is designed to be used as part of the position trading methodology taught on this website and displays key information for targeting and potential entries.

Stock Index Hedge EA
Take advantage of the opening volatility of the major stock indexes and profit from the sudden moves created at those times when the market breaks away at the opening bell. The strategies’ goal is to simply benefit from those days when the market moves fast and hard in one direction at the open and bank that move.