
The Strat Dashboard Indicator
The Strat Dashboard is a powerful, professional-grade indicator designed specifically for traders using Rob Smith’s renowned “Strat” trading methodology. Monitor unlimited symbols across multiple timeframes simultaneously, identify high-probability setups instantly, and never miss another actionable pattern.
More Information & Purchase Links

🎯 What is “The Strat”?
The Strat is a revolutionary price action trading strategy developed by Rob Smith that focuses on identifying specific candlestick patterns and their relationships across timeframes. The methodology classifies each candle into numbered categories based on how they interact with previous candles, creating a universal language for reading price action that works on any market, any timeframe, any time.
Download "The Strat" Strategy Guide
Learn more about the strategy, how it work and how the dashboard can help you find those setups instantly!
The Strat Candle Classification System:
- 1 Bar (Inside Bar): Current candle’s high is lower than previous high AND low is higher than previous low – indicates consolidation
- 2 Bar (Directional Bar): Candle moves in one direction without taking out both previous levels
- 2U (Up): Higher high and higher low
- 2D (Down): Lower high and lower low
- 3 Bar (Outside Bar): Current candle’s high is higher than previous high AND low is lower than previous low – indicates expansion and potential reversal
🚀 Key Features & Benefits
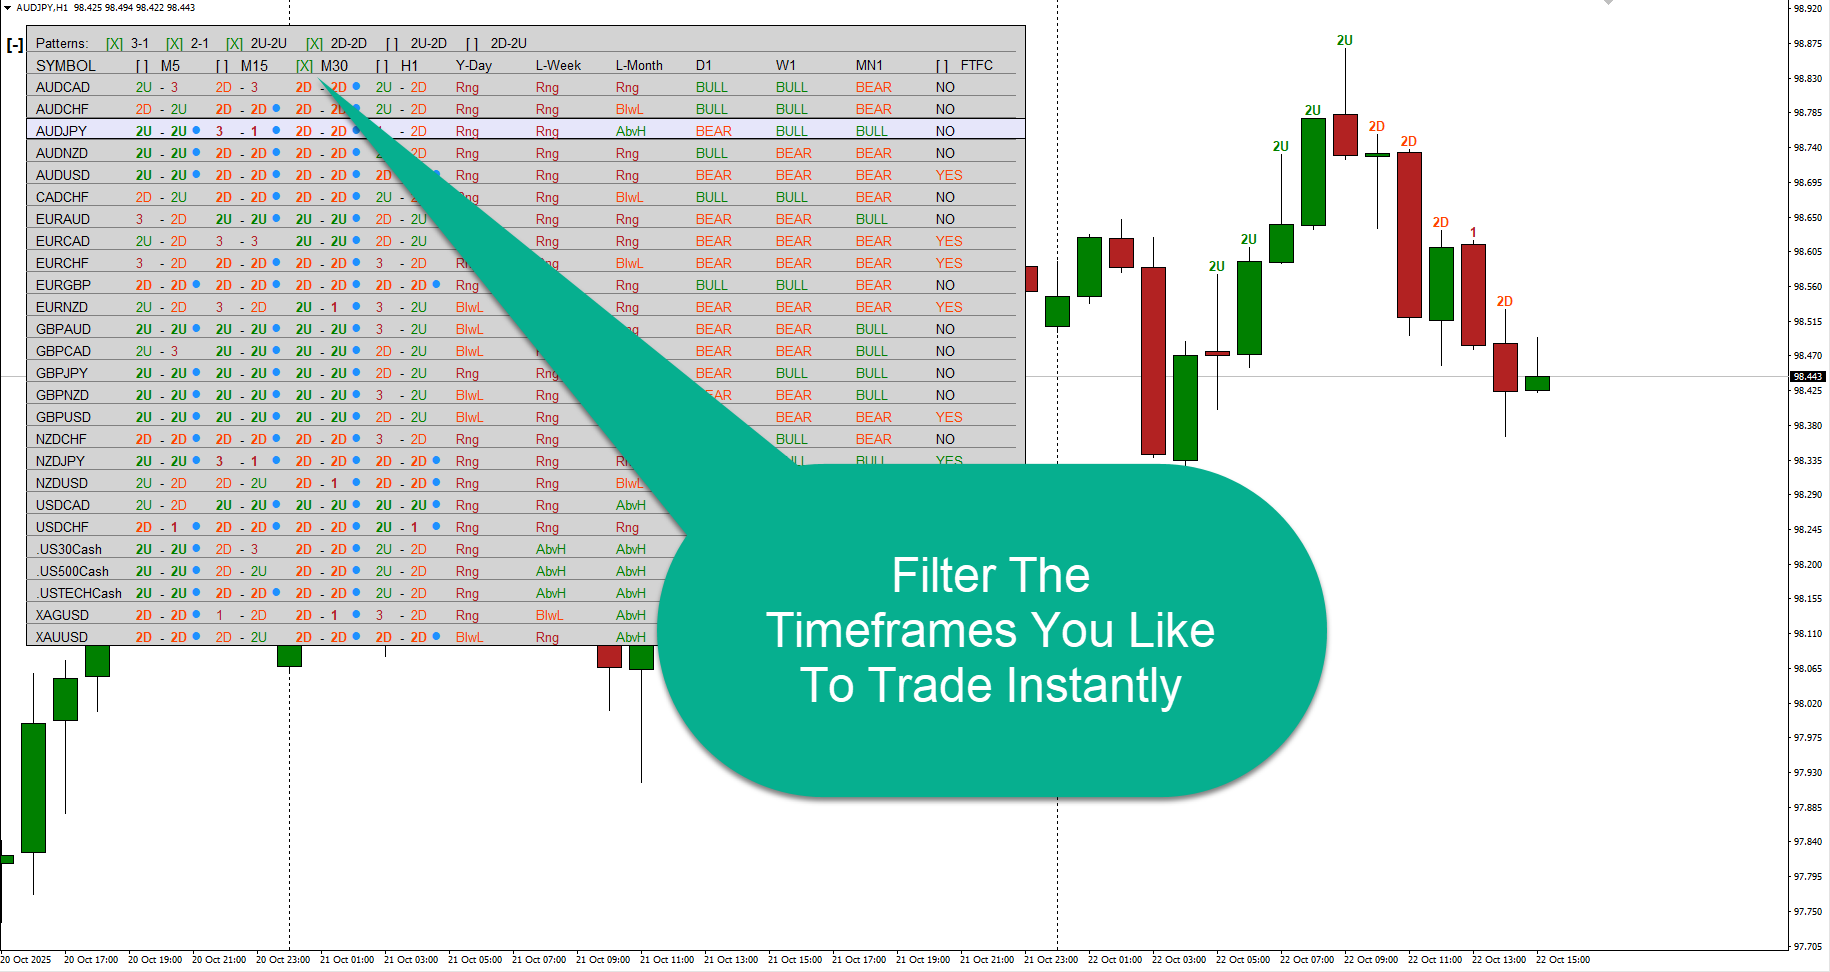
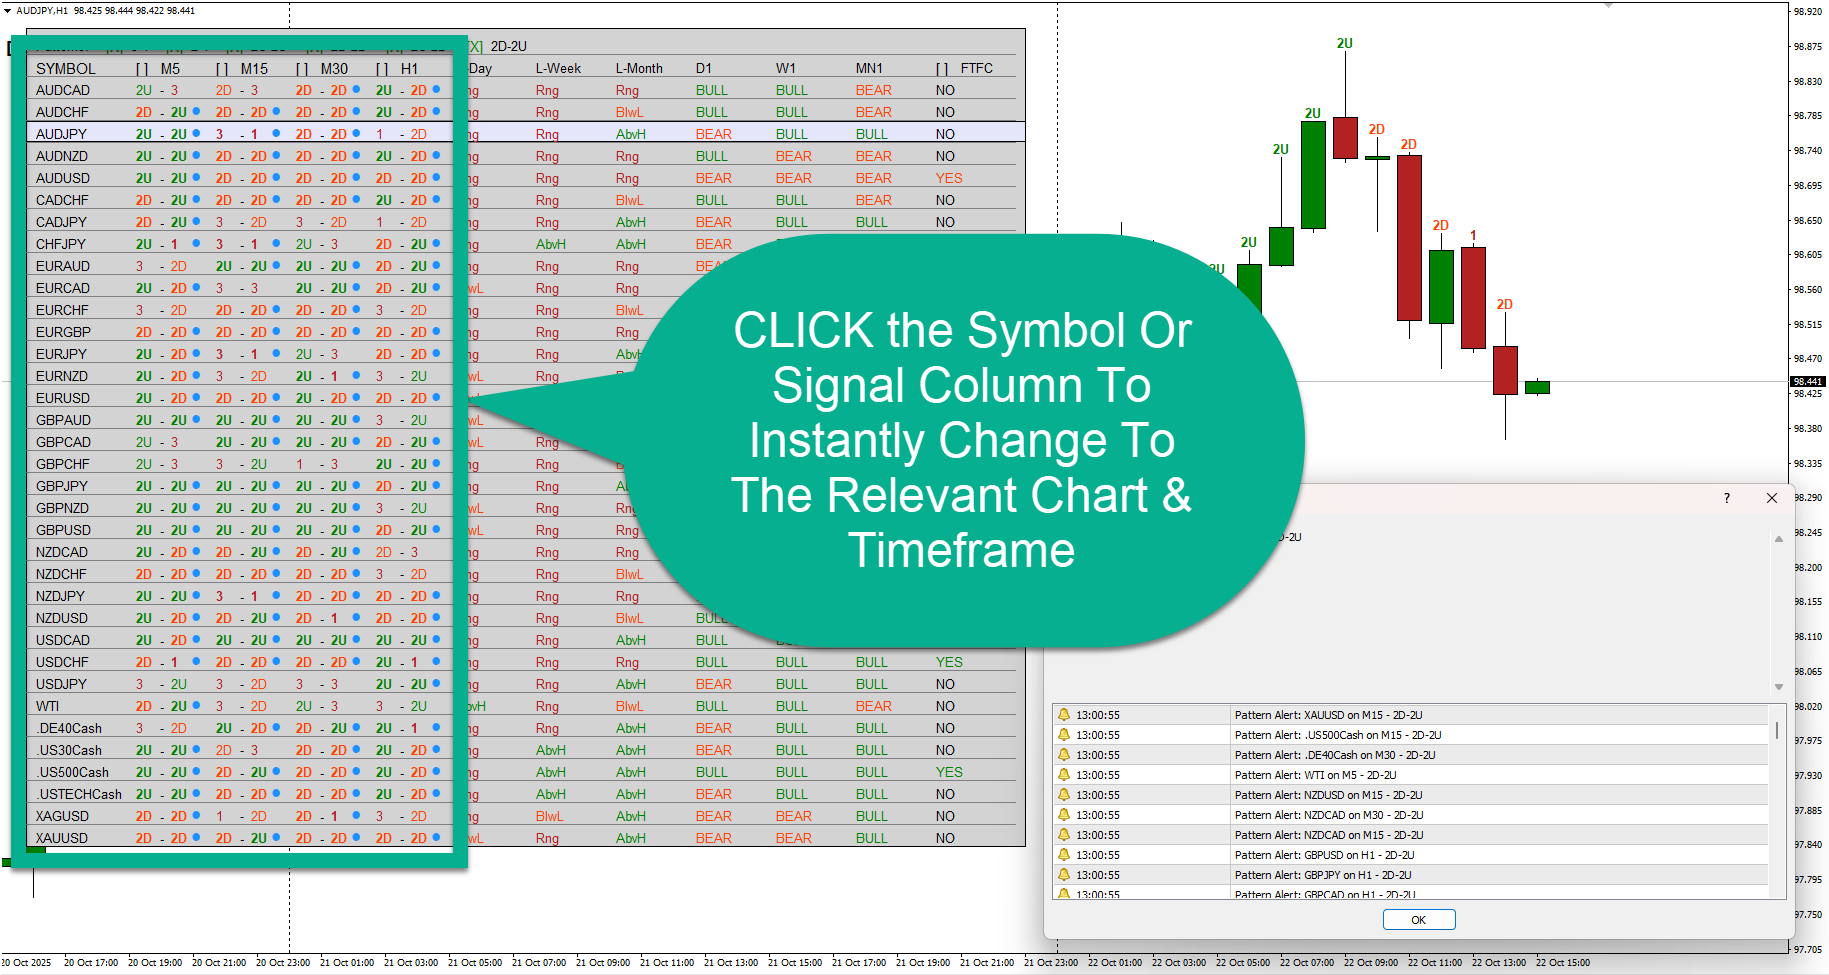
✅ Multi-Symbol Monitoring Dashboard
Stop flipping between charts! Monitor 10, 20, or even 50+ currency pairs simultaneously in one organized dashboard. See exactly which symbols are setting up in real-time without missing opportunities.
- Market Watch Integration: Automatically scans all symbols in your Market Watch window
- Custom Symbol Lists: Create your own watchlists by entering specific symbols
- Current Symbol Highlighting: Instantly identify which symbol you’re currently viewing
✅ Multi-Timeframe Analysis
See the complete picture across 4 timeframes at once. Identify where your trading timeframe aligns with higher timeframes for the highest probability setups.
- Configurable timeframes (M1, M5, M15, M30, H1, H4, D1, W1, MN1)
- Display 2-bar combinations for each timeframe
- Color-coded candle types for instant recognition
- Default setup: M5, M15, M30, H1 (customizable to your strategy)
✅ Intelligent Pattern Detection & Filtering
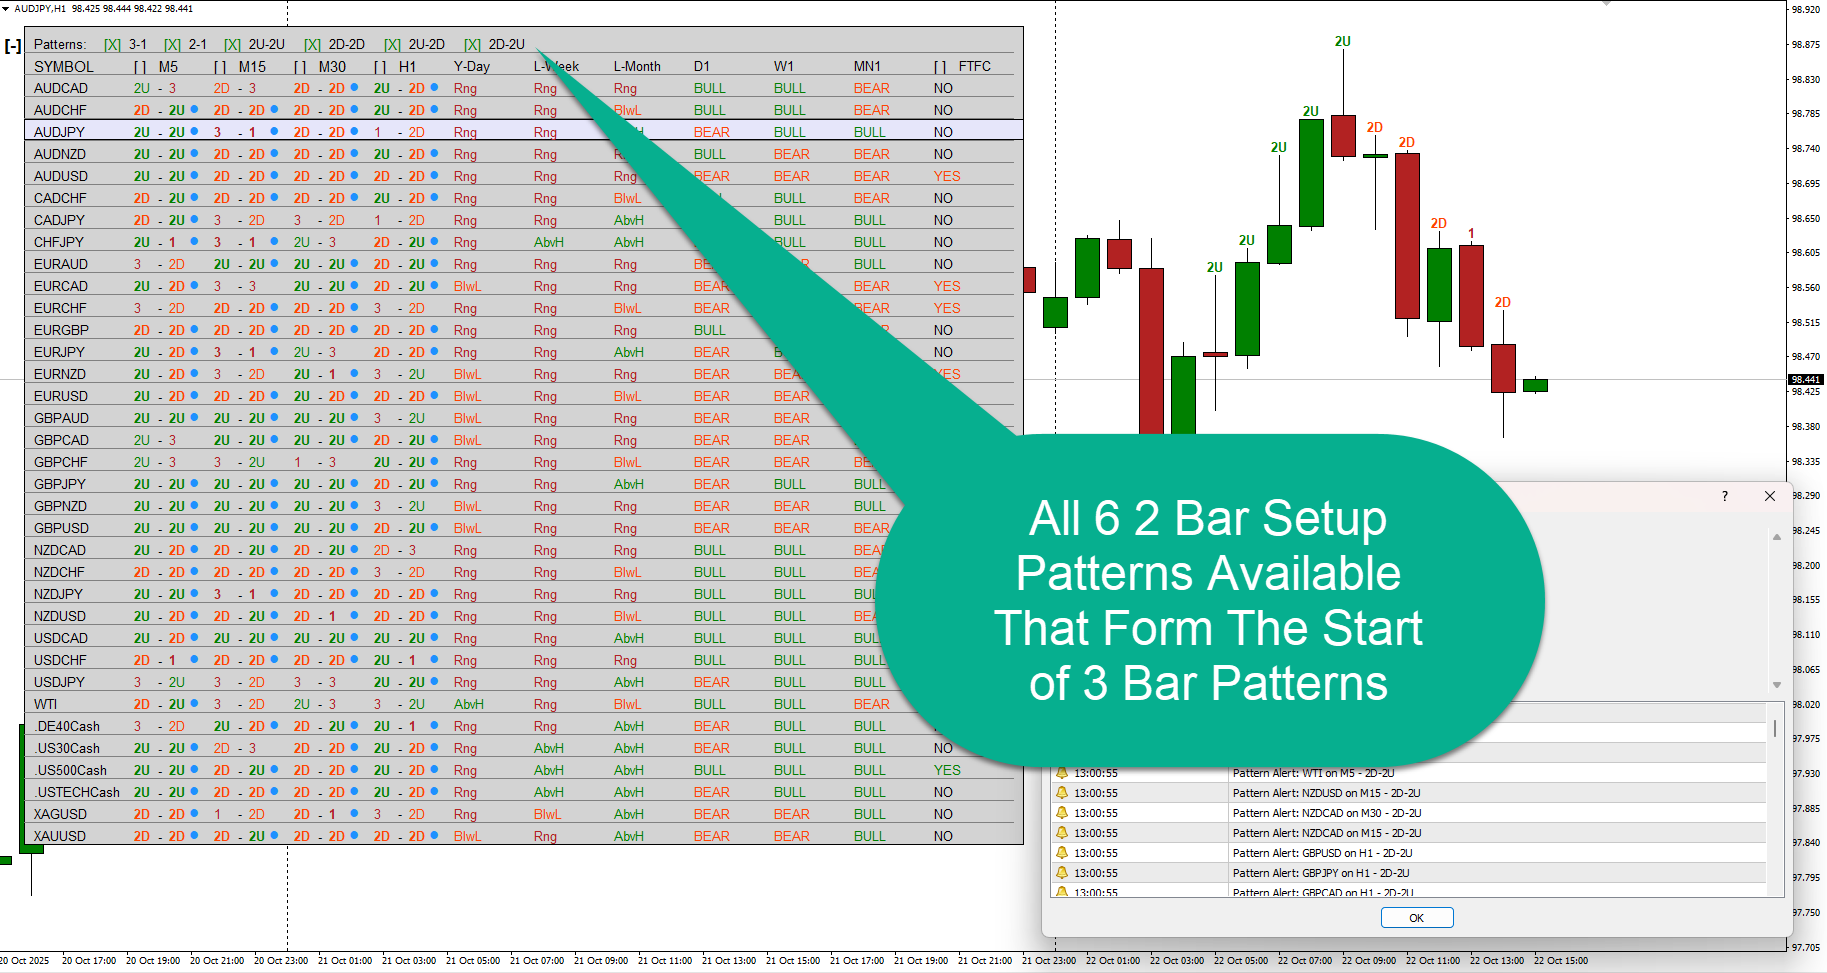
Focus on what matters. Advanced filtering system lets you scan for specific high-probability Strat patterns:
- 3-1 Pattern: Outside bar followed by inside bar (potential breakout setup)
- 2-1 Pattern: Directional bar into inside bar (continuation or reversal setup)
- 2U-2U Pattern: Two consecutive up bars (bullish continuation)
- 2D-2D Pattern: Two consecutive down bars (bearish continuation)
- 2U-2D Pattern: Up bar followed by down bar (potential reversal)
- 2D-2U Pattern: Down bar followed by up bar (potential reversal)
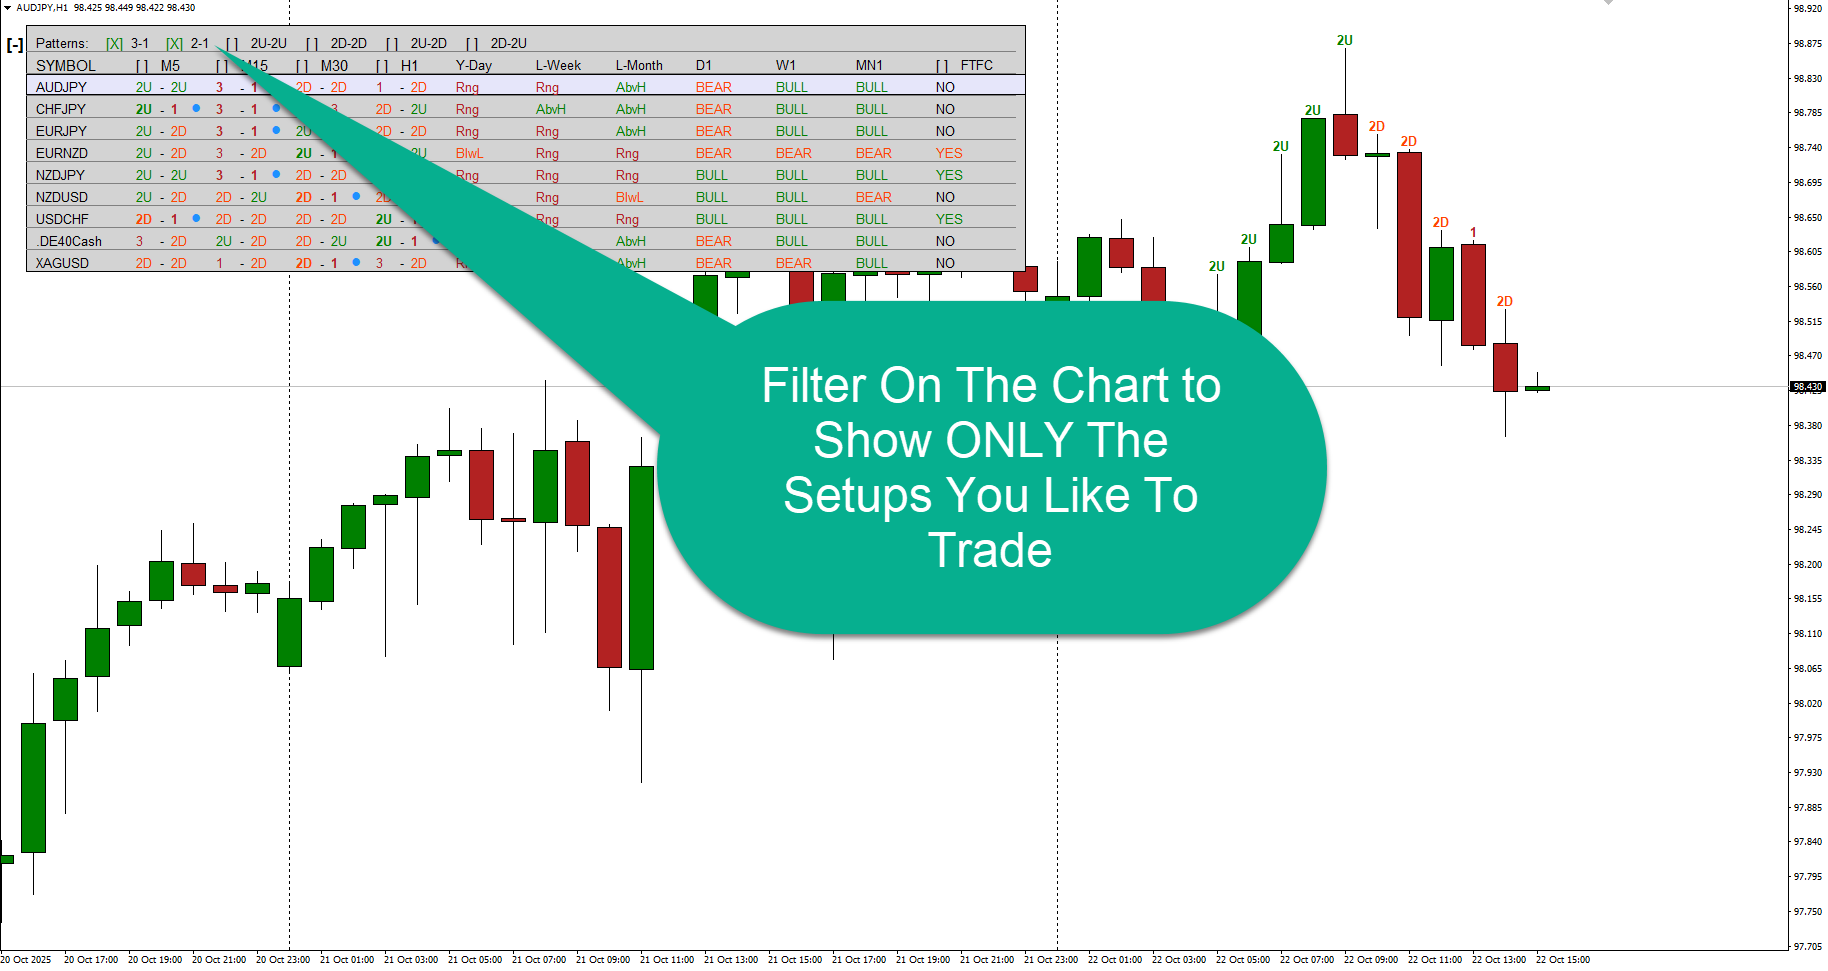
Interactive checkboxes let you toggle patterns on/off instantly – only see the setups you trade!
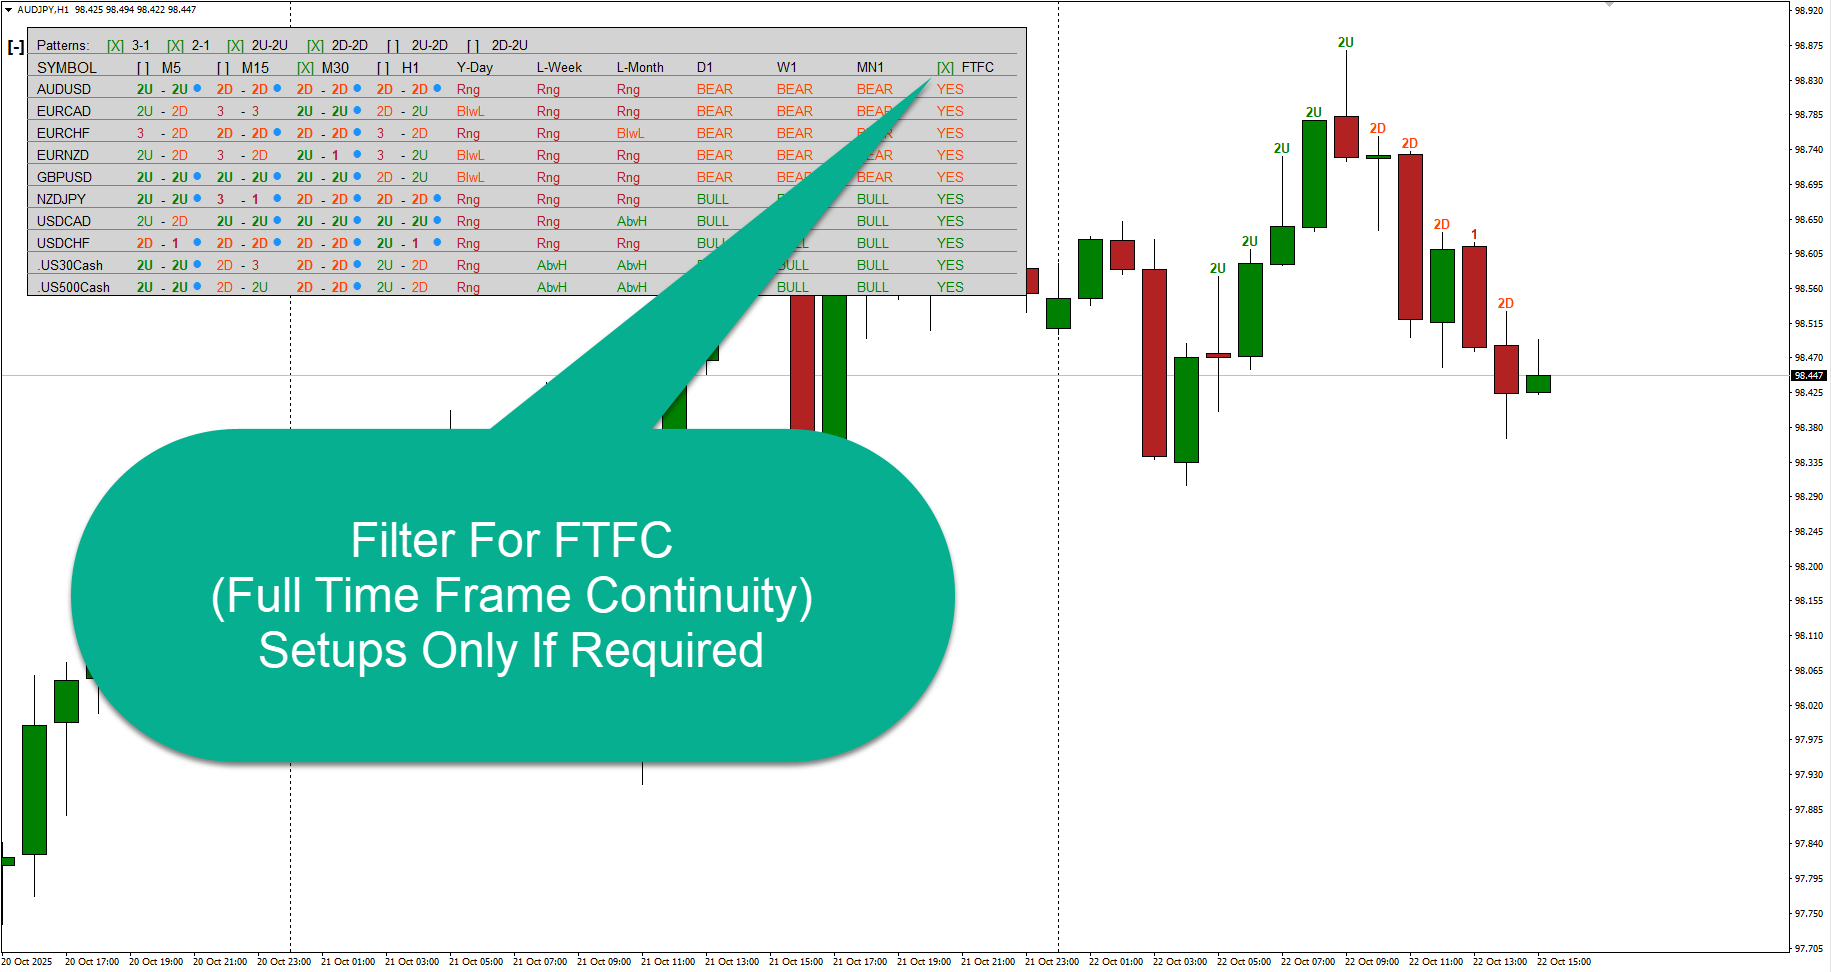
✅ Full Timeframe Continuity (FTFC) Detection
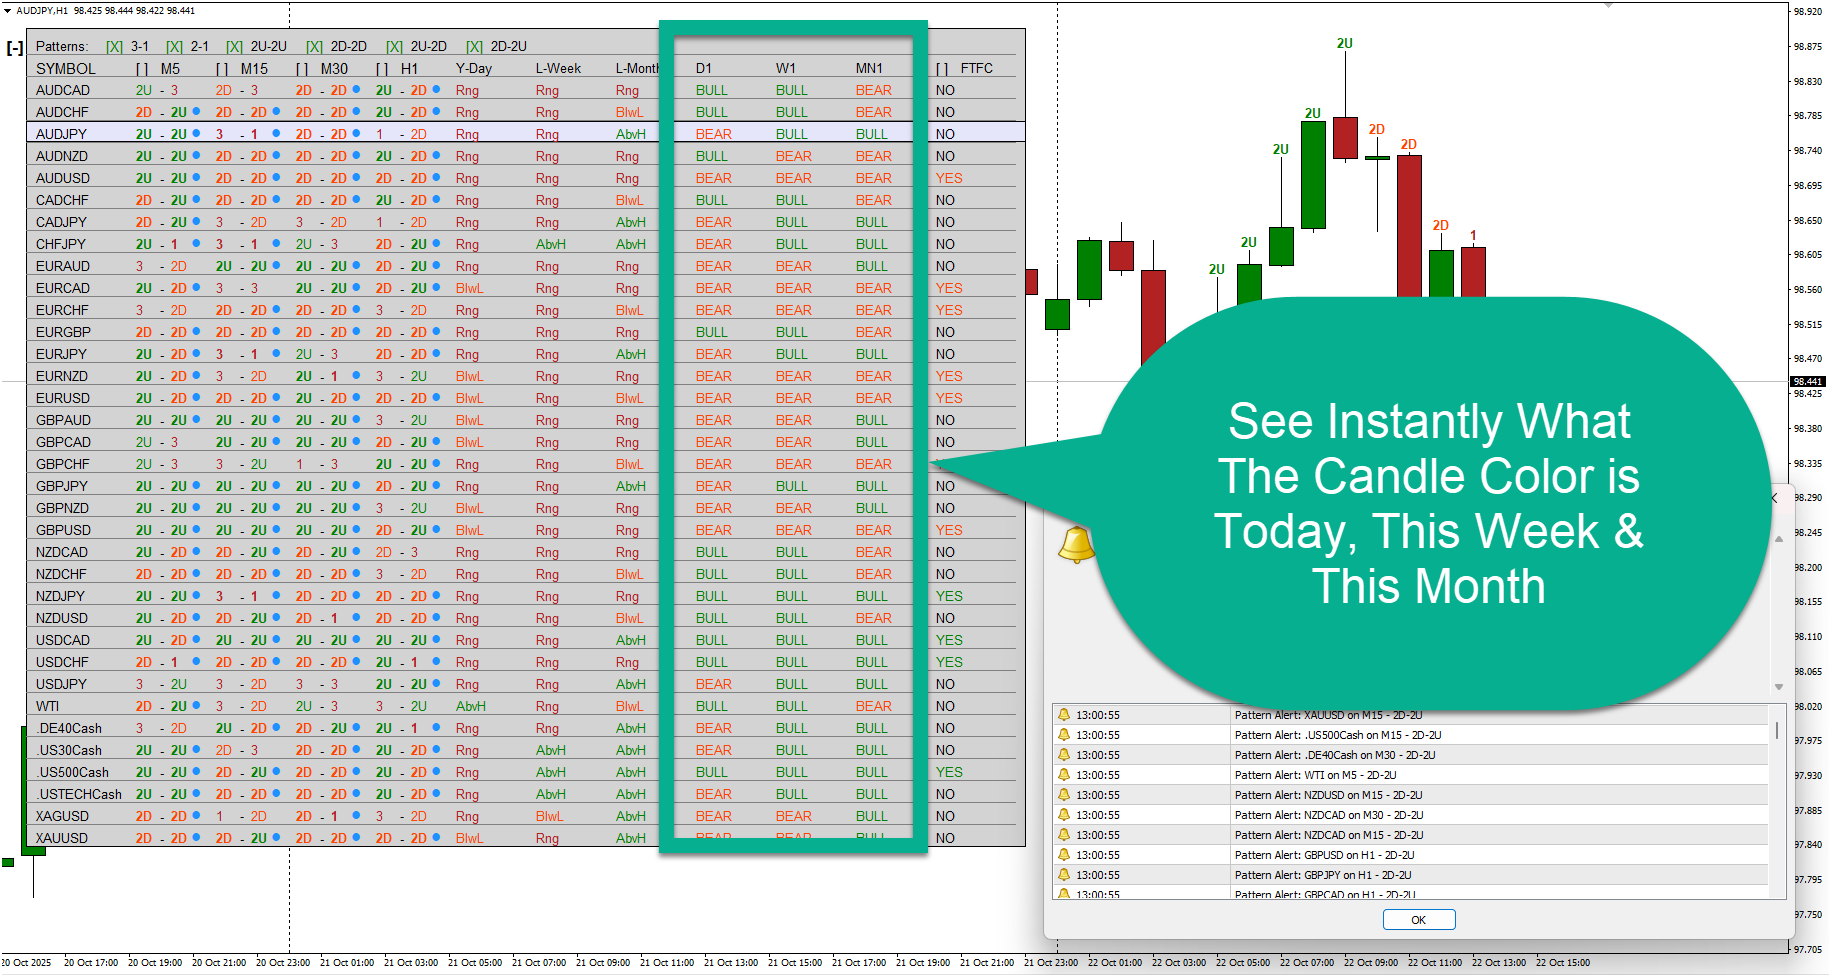
Trade with the trend across all timeframes. The dashboard automatically identifies when your higher timeframes (Daily, Weekly, Monthly) are all aligned bullish or bearish.
- Instant visual confirmation of directional alignment
- Filter to show ONLY symbols with FTFC
- Increases probability of successful trades
- Shows current candle color (BULL/BEAR/DOJI) for each monitored timeframe
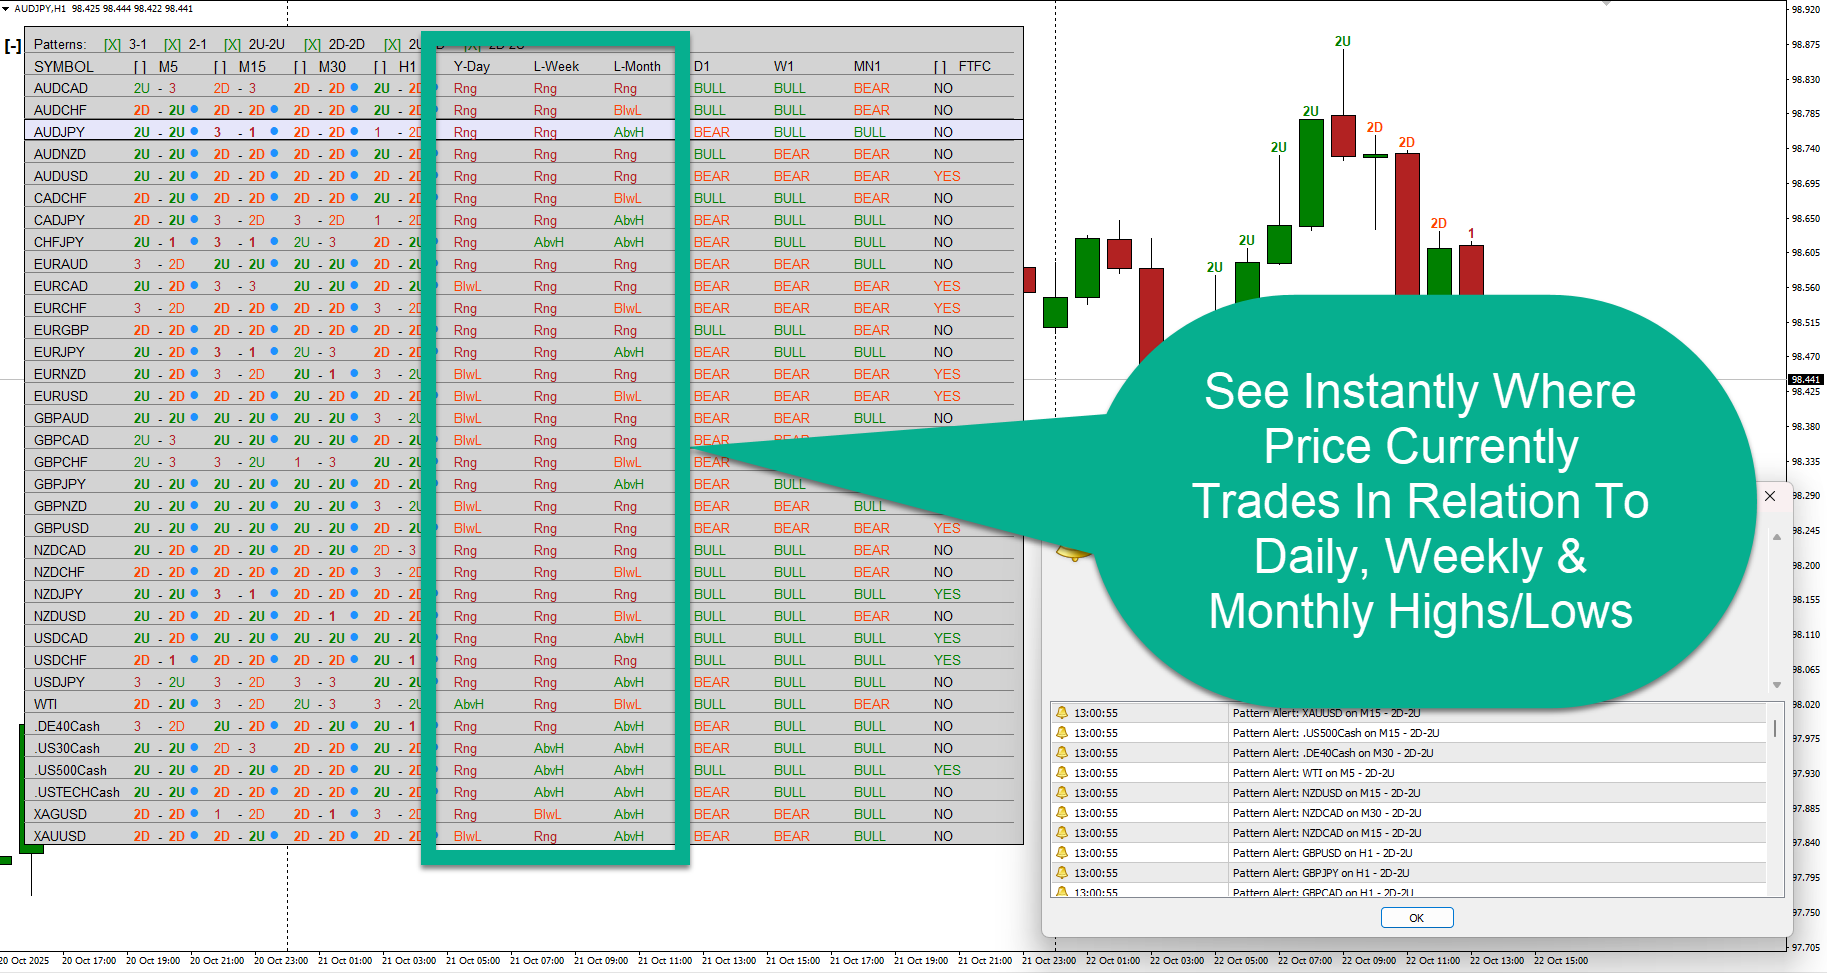
✅ Key Level Awareness
Know where price is in relation to critical levels. The dashboard displays current price position relative to:
- Yesterday’s High/Low: Daily pivot levels
- Last Week’s High/Low: Weekly structure
- Last Month’s High/Low: Monthly context
Three status indicators:
- AbvH: Price is above the previous period’s high (bullish)
- BlwL: Price is below the previous period’s low (bearish)
- Rng: Price is within the previous period’s range (neutral)
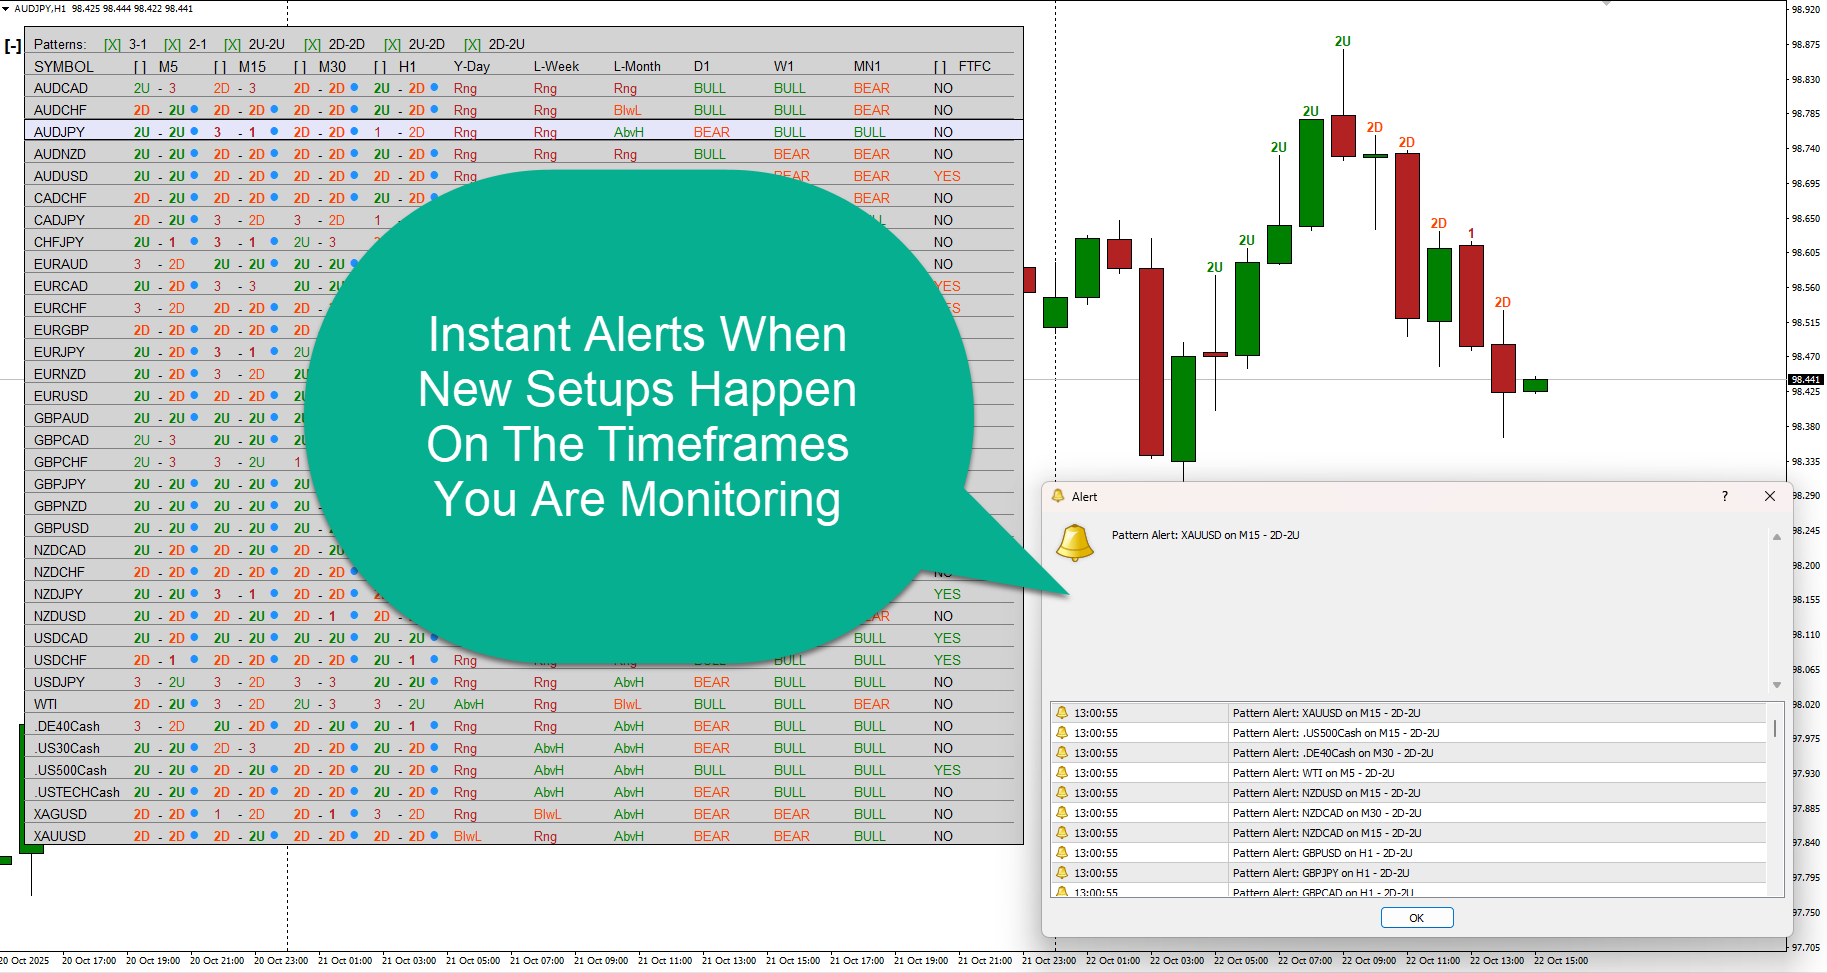
✅ Real-Time Alert System
Never miss a setup again. Configurable alerts notify you the instant a pattern forms:
- Pop-up alerts on your screen
- Journal log entries for record-keeping
- Alerts fire once per bar to avoid spam
- Only alerts on patterns you’ve filtered for
- 24/7 monitoring while the indicator is active
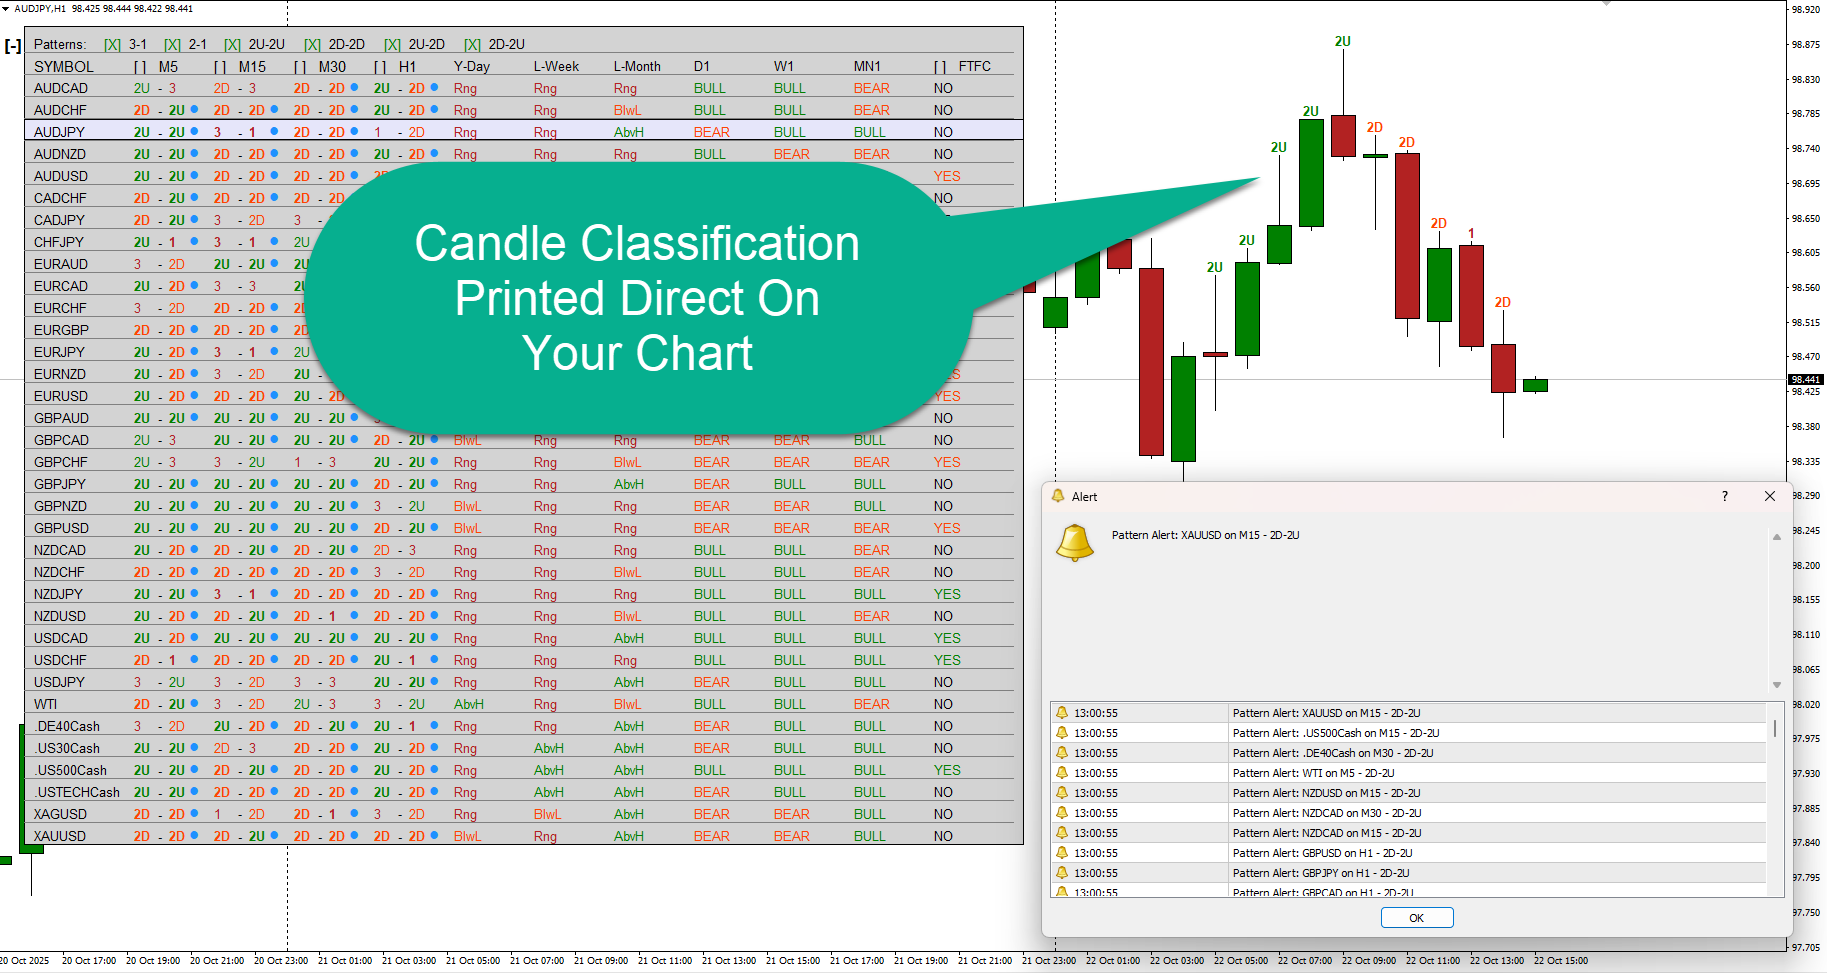
✅ On-Chart Candle Labels
Learn as you trade. Optional candle classification labels appear directly on your current chart:
- See the Strat numbers above recent candles
- Color-coded to match the dashboard
- Configurable lookback period
- Helps you internalize the classification system
- Perfect for new Strat traders
✅ Interactive Dashboard
One-click access to any setup. The dashboard isn’t just for viewing – it’s interactive:
- Click any symbol to instantly switch to that chart
- Click any timeframe cell to switch to that symbol AND timeframe
- Toggle button to show/hide dashboard
- Alert indicators show which patterns are active
- Persistent filter settings across sessions
✅ Professional Design & Customization
Make it yours. Fully customizable appearance to match your trading style:
- Adjustable position (X/Y coordinates)
- Configurable colors for text, background, highlights
- Customizable column widths and row heights
- Font size controls
- Optional row lines for easier reading
- Current symbol highlighting
📊 How to Use The Strat Dashboard for Trading
Step 1: Setup Your Scanner
- Choose Your Symbols: Enable “Use Market Watch” to scan all symbols you follow, or enter specific pairs in “Symbols List”
- Select Timeframes: Configure your 4 analysis timeframes (e.g., M5, M15, M30, H1 for day trading)
- Set Candle Direction Timeframes: Choose higher timeframes for FTFC analysis (typically D1, W1, MN1)
Step 2: Filter for Your Setups
Use the interactive checkboxes to filter for patterns you trade:
For Reversal Traders:
- Enable 3-1 patterns (outside bar into inside bar – classic reversal setup)
- Enable 2U-2D and 2D-2U (directional change patterns)
For Continuation Traders:
- Enable 2U-2U (bullish continuation)
- Enable 2D-2D (bearish continuation)
- Enable FTFC filter for trend-aligned trades
For Breakout Traders:
- Enable 3-1 patterns (potential breakout from inside bar)
- Enable 2-1 patterns (directional bar into consolidation)
Step 3: Scan for Opportunities
The dashboard now shows ONLY symbols meeting your criteria:
- Look for Alert Indicators: Blue dots appear next to patterns matching your filters
- Check FTFC Status: “YES” indicates all higher timeframes aligned
- Review Key Levels: See if price is above high (AbvH), below low (BlwL), or in range (Rng)
- Assess Timeframe Alignment: Look across columns to see if patterns align across timeframes
Step 4: Execute Your Trade
- Click the Symbol or Pattern: Instantly opens that chart
- Confirm the Setup: Use additional Strat principles (combo patterns, key levels, FTFC)
- Plan Your Trade: Inside bars (1’s) provide clear stop loss levels
- Manage Position: Use higher timeframe patterns as targets
Example Trading Scenarios:
Scenario 1: Bullish Reversal Setup
- Filter: 3-1 pattern enabled
- Dashboard shows: EURUSD with 3-1 on H1 timeframe
- FTFC: All higher timeframes are BULL
- Key Level: Price is BlwL (below yesterday’s low – near support)
- Trade: Look for long entry on break above the inside bar (1) high, stop below the inside bar low
Scenario 2: Bearish Continuation
- Filter: 2D-2D pattern enabled, FTFC enabled
- Dashboard shows: GBPUSD with 2D-2D on M30
- FTFC: YES (all timeframes bearish)
- Key Level: Price is AbvH on yesterday’s range (broken down and retesting)
- Trade: Short on rejection at resistance, targeting lower key levels
Scenario 3: Breakout Setup
- Filter: 2-1 pattern enabled
- Dashboard shows: USDJPY with 2U-1 on M15
- Following timeframe (M30) shows 2U-2U confirmation
- FTFC: YES (bullish alignment)
- Trade: Long on break above inside bar, riding the continuation
⚙️ Complete Input Parameters Guide
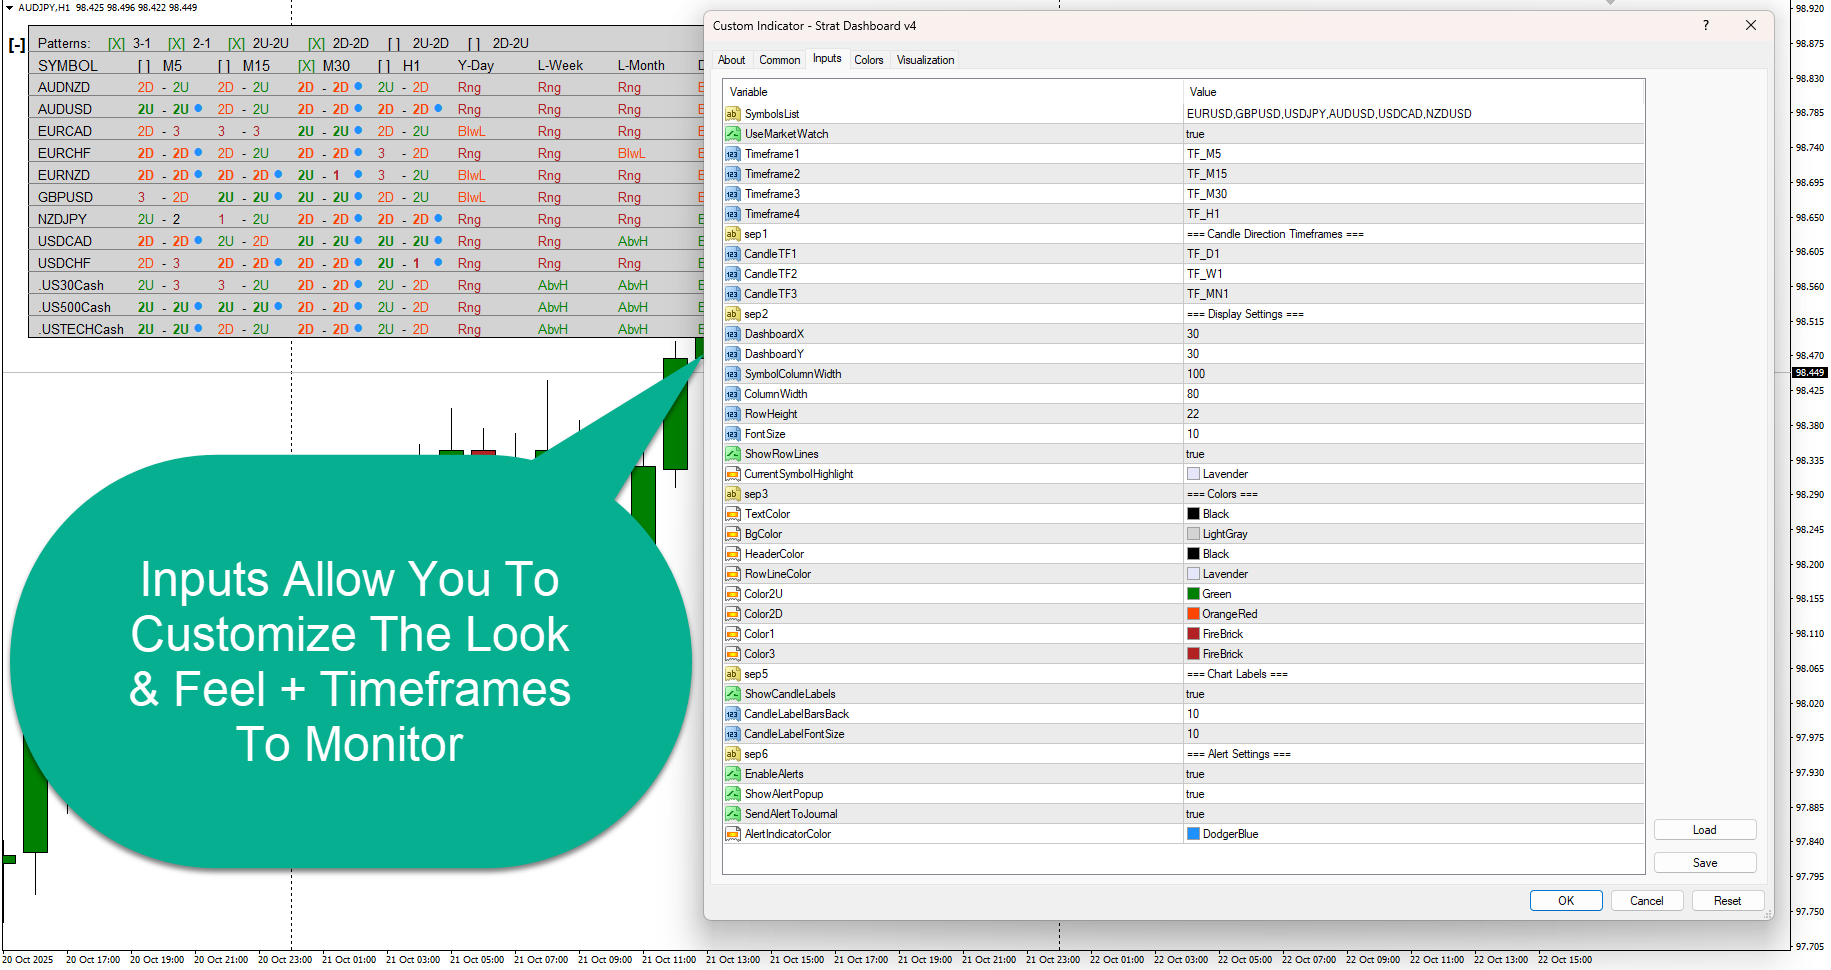
Symbol Selection
Symbols List (Default: “EURUSD,GBPUSD,USDJPY,AUDUSD,USDCAD,NZDUSD”)
- Comma-separated list of symbols to monitor when not using Market Watch
- Example: “EURUSD,GBPUSD,XAUUSD,US30,BTC”
- Spaces are automatically removed
Use Market Watch (Default: true)
- When enabled: Automatically scans all symbols visible in your Market Watch window
- When disabled: Uses the manual Symbols List above
- Recommendation: Enable for comprehensive scanning
Trading Timeframes
Timeframe 1 (Default: M5)
- First analysis timeframe column in dashboard
- Typically your entry/execution timeframe
Timeframe 2 (Default: M15)
- Second analysis timeframe
- Often used for confirmation of lower timeframe
Timeframe 3 (Default: M30)
- Third analysis timeframe
- Higher timeframe context
Timeframe 4 (Default: H1)
- Fourth analysis timeframe
- Highest analysis timeframe for intraday setups
- Options: M1, M5, M15, M30, H1, H4, D1, W1, MN1
Candle Direction Timeframes
Candle TF 1 (Default: D1)
- First timeframe for FTFC analysis
- Shows current candle direction (BULL/BEAR/DOJI)
Candle TF 2 (Default: W1)
- Second timeframe for FTFC analysis
- Weekly trend direction
Candle TF 3 (Default: MN1)
- Third timeframe for FTFC analysis
- Monthly trend direction
- These three must ALL be same direction for FTFC “YES”
Display Settings
Dashboard X (Default: 30)
- Horizontal pixel position from left edge of chart
- Adjust to position dashboard where you prefer
Dashboard Y (Default: 30)
- Vertical pixel position from top of chart
- Move up/down to avoid interfering with your charts
Symbol Column Width (Default: 100)
- Width in pixels for the symbol name column
- Increase if symbol names are cut off
Column Width (Default: 80)
- Width in pixels for all other columns
- Adjust based on screen size and number of symbols
Row Height (Default: 22)
- Height in pixels for each row
- Increase for better readability, decrease to fit more symbols
Font Size (Default: 10)
- Size of text in the dashboard
- Adjust based on screen resolution
Show Row Lines (Default: true)
- Displays horizontal lines between rows
- Improves readability with many symbols
Current Symbol Highlight (Default: Lavender)
- Background color for row showing the currently selected symbol
- Helps you quickly identify which chart you’re viewing
Color Customization
Text Color (Default: Black)
- Color for regular text and standard bars
Background Color (Default: Light Gray)
- Dashboard background color
Header Color (Default: Black)
- Color for column headers and labels
Row Line Color (Default: Lavender)
- Color of horizontal dividing lines between rows
Color 2U (Default: Green)
- Color for 2U (up) bars and bullish indicators
- Also used for “YES” FTFC and prices above highs
Color 2D (Default: Orange Red)
- Color for 2D (down) bars and bearish indicators
- Also used for prices below lows
Color 1 (Default: Fire Brick)
- Color for 1 (inside) bars
- Also used for ranging price indicators
Color 3 (Default: Fire Brick)
- Color for 3 (outside) bars
Chart Label Settings
Show Candle Labels (Default: true)
- When enabled: Displays Strat numbers above candles on your current chart
- When disabled: No on-chart labels shown
Candle Label Bars Back (Default: 10)
- Number of previous bars to show labels on
- Increase to see more history, decrease for cleaner charts
Candle Label Font Size (Default: 10)
- Size of the numbers shown above candles
- Independent from dashboard font size
Alert Configuration
Enable Alerts (Default: true)
- Master switch for the alert system
- Must be enabled for any alerts to fire
Show Alert Popup (Default: true)
- When enabled: Pop-up window appears when pattern forms
- Shows symbol, timeframe, and pattern type
Send Alert to Journal (Default: true)
- When enabled: Logs alerts to MetaTrader Experts/Journal tab
- Useful for record-keeping and reviewing missed alerts
Alert Indicator Color (Default: Dodger Blue)
- Color of the small dot that appears next to active patterns
- Shows which cells currently meet your filter criteria
🔧 How It Works – Technical Overview
Candle Classification Algorithm
The indicator analyzes each bar by comparing its high and low with the previous bar:
- High/Low Comparison: Uses a 0.00001 point threshold for precision
- Classification Logic:
- Inside Bar (1): Current high < previous high AND current low > previous low
- Outside Bar (3): Current high > previous high AND current low < previous low
- Directional Up (2U): Higher high with higher or equal low
- Directional Down (2D): Lower high with lower or equal low
- 2-Bar Pattern Detection: Displays the previous bar and current bar classification in each timeframe column
- Pattern Matching: Compares 2-bar combinations against enabled filters
Multi-Symbol Data Handling
- Utilizes MT5’s
CopyHigh(),CopyLow(),CopyOpen(),CopyClose()functions - Non-blocking data retrieval – won’t freeze your platform
- Handles missing data gracefully (shows “—” for unavailable data)
- Series arrays set for efficient recent-data access
Alert System
- Timer-Based: Checks for new patterns every 1 second when alerts enabled
- Duplicate Prevention: Uses global variables to track fired alerts
- Bar-Time Tracking: Alerts fire once per new bar formation
- Automatic Cleanup: Removes alert history older than 24 hours
- Pattern-Specific: Only alerts on patterns you’ve filtered for
Filter Persistence
- Filter selections saved as global variables with unique chart ID
- Survives indicator reload, chart switches, and MT5 restarts
- Only deleted when indicator is removed from chart
- Each chart maintains independent filter settings
Interactive Dashboard
- Object-Based Graphics: Uses MT5 rectangle labels and text labels
- Z-Order Management: Proper layering for clickable elements
- Event Handling: OnChartEvent responds to user clicks
- Dynamic Updating: Recalculates on every tick via OnCalculate
- Visibility Control: Toggle button to hide/show without losing data
Performance Optimization
- Only processes visible (filtered) symbols in detail
- Hides objects for filtered-out symbols (not deleted)
- Reuses objects rather than recreating each update
- Efficient string operations and array handling
💡 Pro Tips for Maximum Effectiveness
1. Start with Fewer Patterns
Don’t enable all filters at once. Focus on mastering one or two setups first:
- Beginners: Start with just 3-1 patterns
- Intermediate: Add 2-1 patterns
- Advanced: Use combinations with FTFC filter
2. Match Timeframes to Your Trading Style
- Scalpers: M1, M5, M15, M30
- Day Traders: M5, M15, M30, H1
- Swing Traders: H1, H4, D1, W1
- Position Traders: D1, W1, MN1
3. Use FTFC Filter for Higher Probability
Enable the FTFC checkbox when you only want to trade WITH the larger trend. This dramatically increases win rate but reduces number of setups.
4. Combine with Key Levels
The dashboard shows if price is above/below key levels. Best setups often occur at these areas:
- Look for reversals when price is BlwL or AbvH (extended from range)
- Look for continuations when price is Rng (consolidating before next move)
5. Set Up Multiple Chart Layouts
Create different chart templates with different filter combinations:
- Layout 1: Reversal hunting (3-1, 2U-2D, 2D-2U)
- Layout 2: Continuation trading (2U-2U, 2D-2D, FTFC enabled)
- Layout 3: Breakout setups (2-1 patterns only)
6. Learn the Strat Combos
Once you’re comfortable with 2-bar patterns, study Rob Smith’s combo patterns:
- 2-2-2 Combos: Three directional bars in a row
- 2-1-2 Reversal Combo: Two up, inside bar, two down (or reverse)
- 3-1-2 Broadening Formation: Outside, inside, directional continuation
7. Use Alerts Wisely
- Enable alerts for your highest-probability setups only
- Don’t alert on every pattern type or you’ll get overwhelmed
- Keep MT5 running to receive alerts (doesn’t need to be foreground)
8. Regular Dashboard Review
- Scan dashboard every 15-30 minutes during trading session
- Look for patterns forming across multiple timeframes on same symbol
- Check symbols that weren’t showing patterns earlier – conditions change
📈 What Makes This Dashboard Different?
Versus Manual Scanning:
- Speed: Analyze 50 pairs in 2 seconds vs. 10 minutes manually
- Accuracy: Never misidentify a candle type
- Completeness: Never miss a setup while looking at other charts
- Consistency: Same classification logic every time
Versus Generic Scanners:
- Strat-Specific: Built FOR Strat traders BY Strat traders
- Pattern Recognition: Understands 2-bar combos, not just individual candles
- FTFC Integration: Built-in directional bias across timeframes
- Key Level Context: Shows relative position to critical levels
Versus Similar Indicators:
- Multiple Timeframes: 4 analysis TFs + 3 directional TFs = 7 timeframes per symbol
- Interactive Filtering: Change what you’re looking for without reopening settings
- Comprehensive Patterns: All six common 2-bar Strat patterns included
- Alert System: Never miss a setup even when away from screen
- Persistent Settings: Filters remain across sessions and chart switches
🎓 Perfect For:
✅ Strat Methodology Traders – Purpose-built for Rob Smith’s strategy
✅ Multi-Market Traders – Monitor Forex, Indices, Commodities, Crypto simultaneously
✅ Part-Time Traders – Alerts ensure you don’t miss setups
✅ Systematic Traders – Consistent, objective pattern identification
✅ Learning Traders – On-chart labels help internalize the Strat system
✅ Professional Traders – Handle multiple accounts and asset classes efficiently


Join the Telegram Group
Join the Discord Server
Get The Indicators & Dashboards I use
The indicators are all available direct from your MT4 or MT5 platform in the market section. Alternatively, you can get them on the MQL5.com website!

The Market Reversal Alert Indicator
The key to the strategy is knowing when price is starting to turn and change direction. This indicator draws in market structure for you, then sends you an alert so you can take a look at your charts and see if there is a valid reason to enter a trade.

The Market Reversal Alert Dashboard
This amazing dashboard monitors the major time frames and all pairs you trade and alerts you instantly when a potential reversal happens. No more staring at charts all day! Every pair and key time frame in front of you in one MT4 window. Priceless.

The ADR Reversal Indicator
The ADR Reversal Indicator shows you at a glance where price is currently trading in relation to its normal average daily range. You will get instant alerts via pop-up, email or push when price exceeds its average range and levels above it of your choosing.

The ADR Alert Dashboard
The ADR reversal dashboard allows you to monitor every pair or instrument you trade in one dashboard. You’ll get alerted every time something exceeds your set ADR levels and ensure you will never miss an opportunity.

The Trade Manager Dashboard
Take control of your forex portfolio. See instantly where you stand, what's working and what's causing you pain! The Trade Manager Dashboard is designed to make risk management and exposure to currencies easier to understand.

The RSI and TDI Alert Dashboard
The RSI / TDI alert dashboard allows you to monitor 6 main timeframes (selectable by you) at once on every major pair you trade. The dashboard will alert you to extended conditions (overbought and oversold) when a candle closes on the chosen time frame.

Symmetrical Triangle Pattern Indicator
Profit from market contraction and consolidation after price makes new highs or lows in the market. Get alerted when a contraction is happening, ready to pounce on the next continuation or reversal move that is building up.

Symmetrical Triangle Pattern Dashboard
Get alerted and see instantly when any instrument you trade forms a symmetrical triangle pattern on any time frame. Get ready to pounce on those triangle breakouts!

Opening Range Breakout EA
Profit from the explosive moves that occur at the open of stock indices and give yourself an actionable edge every day. The opening range breakout EA can be tweaked to your liking to capture the trends that form just after the open every day on the main stock indices like the DAX, DOW, NASDAQ and S&P500.

The Market Reversal Alerts EA
Based on the indicator, this EA will auto trade signals generated from the market reversal alerts indicator. It has powerful filters to configure as you like to trade including ADR, MAs and RSI. You can also use it to basket/grid trade, and it has every risk option you can imagine.

The Price Action Toolkit EA
The missing piece of functionality in MT4!
Fast order buttons to quickly enter, adjust and exit positions and scalp with lightning speed. Get price action candlestick alerts on the most commonly traded patterns and auto execute entries and exits based on your preferences.

Support, Resistance & Propulsion Gaps
Automatically draw support and resistance levels PLUS propulsion candle gaps on your chart, so you can see where price is likely to head next and/or potentially reverse. This indicator is designed to be used as part of the position trading methodology taught on this website and displays key information for targeting and potential entries.

Stock Index Hedge EA
Take advantage of the opening volatility of the major stock indexes and profit from the sudden moves created at those times when the market breaks away at the opening bell. The strategies’ goal is to simply benefit from those days when the market moves fast and hard in one direction at the open and bank that move.